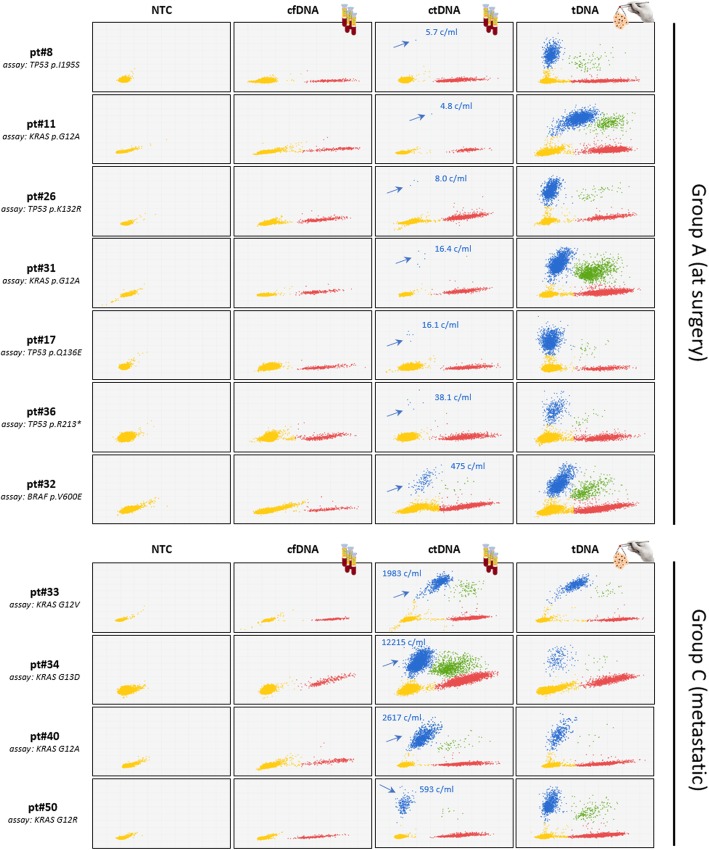
Fig. 2.
dPCR analysis of ctDNAs at surgery and from patients bearing metastatic CRC. ctDNAs/tDNA pairs from representative patients (at surgery and metastatic, upper and lower panels, respectively) were assessed by dPCR. Different input DNAs were used in different rows: NTC, no template control; cfDNA, circulating free DNA from healthy donors; ctDNAs and tDNAs, paired tumor and plasma samples from any given patient. Group A patients are arranged top to bottom in order of increasing pathological staging and grading. Yellow, red, blue and green dots depict not amplified, WT, MUT and double-positive dPCR spots, respectively. Red, blue and green dots altogether: cfDNA. Blue and green dots: ctDNA. ctDNA copies per mL are noted

