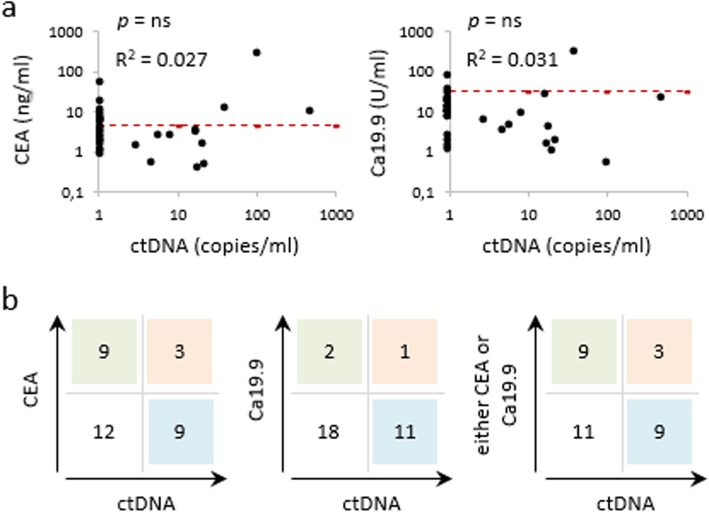
Fig. 4.
Comparison between conventional serum biomarkers and circulating DNA. a Regression analysis of ctDNA dPCR values on the day of surgery paired with serum CEA and Ca19.9 levels assessed in the 15 days prior to surgery. All values are in logarithmic scale. Regression coefficients and p values are shown. ns: nonsignificant. Red dotted lines: CEA and Ca19.9 positivity threshold (4.7 ng/ml and 34 U/ml, respectively). Samples with undetectable ctDNAs are aligned to the Y axis. b A scoring matrix was built to match dPCR positives (any value) and negatives (undetectable) on the one hand vs CEA and Ca19.9 positives and negatives on the other

