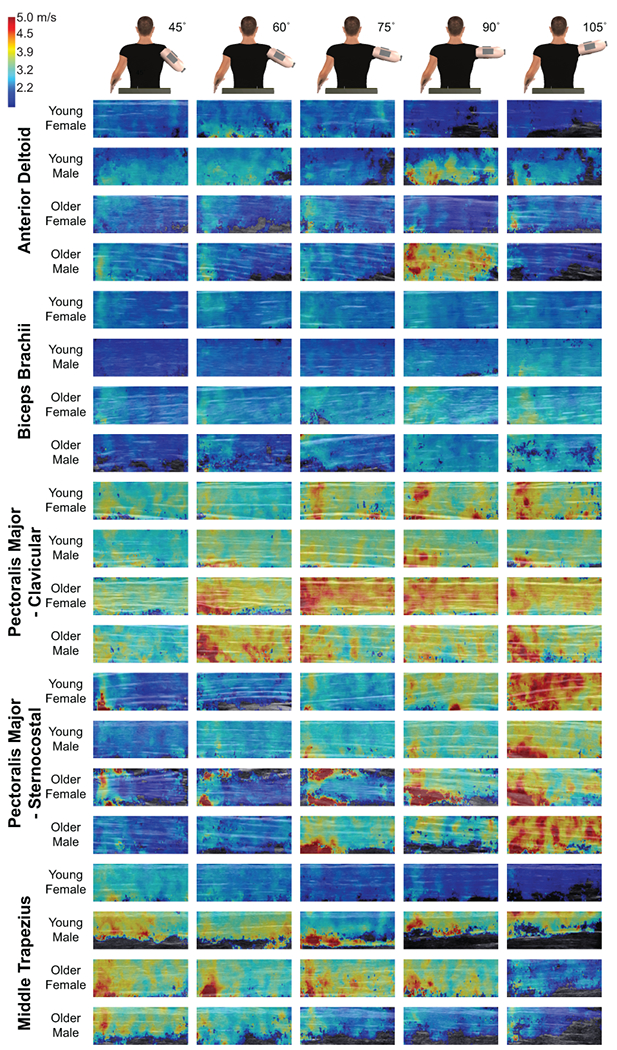
Figure 3:

Typical shear wave elastography maps for the five examined muscles. For each muscle, each row shows the images from a representative young female, young male, older female, and older male participants. Each column indicates the resultant color map at a given humeral elevation angle. A legend for the color maps is shown in the upper right corner.
