
Figure 5:
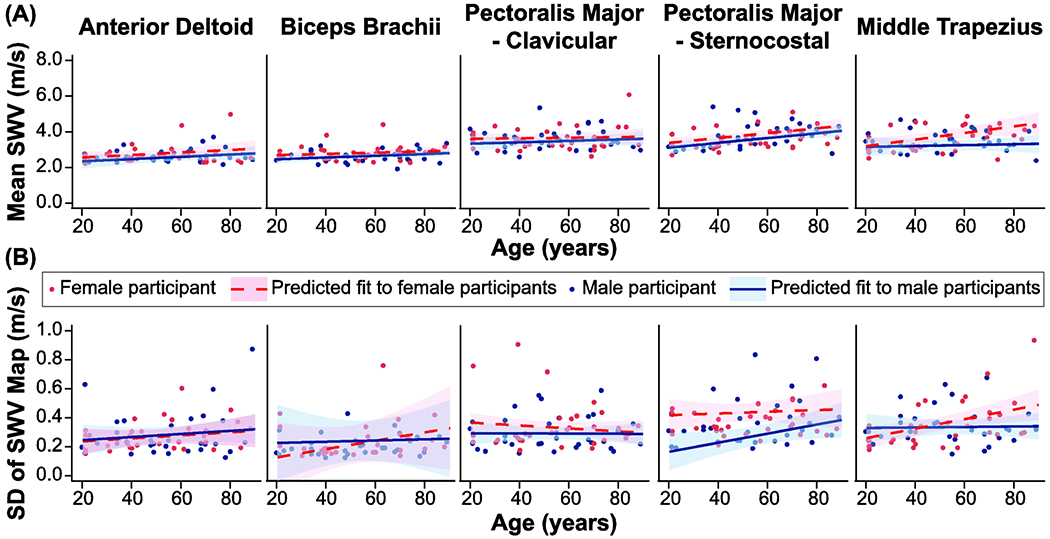
Influence of chronological age on (a) mean shear wave velocity (SWV) and (b) the standard deviation of the SWV map for five examined muscles (anterior deltoid, biceps brachii, clavicular and sternocostal regions of the pectoralis major, and middle trapezius). Blue filled circles represent data from male participants and red filled circles represent data from female participants. For each muscle, data is only displayed for the humeral elevation angle that produced the largest SWV for the group. The anterior deltoid and middle trapezius are displayed at 45 degrees, the clavicular region of the pectoralis major is displayed at 75 degrees, and the biceps brachii and sternocostal regions of the pectoralis major are displayed at 105 degrees. The resultant fit of the linear mixed model for each sex (blue solid line – male; red dashed line – female) with shaded regions indication 95% confidence intervals. For each muscle, the model was fit using the parameters provided in Table 3, and calculated using the median body mass index (26.5 kg/m2) and functional scores (hand dynamometer: 36.2 kg; Purdue Pegboard time: 22.1 sec; time to button shirt/blouse: 29.3 sec) for the entire group.