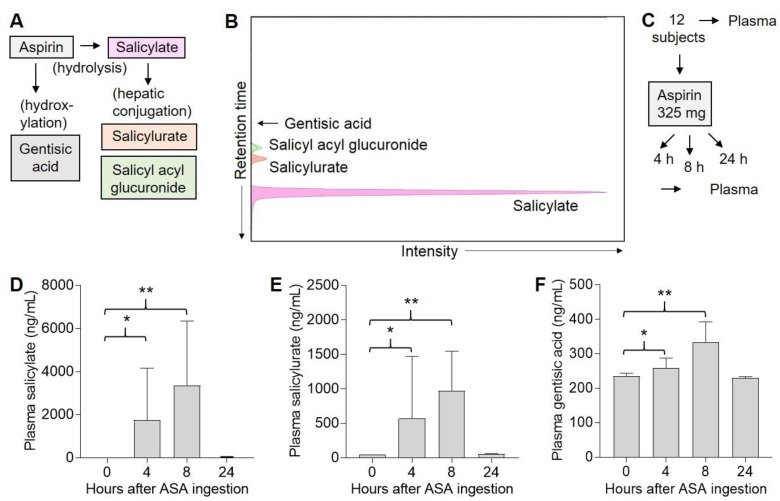
Figure 2.
Detection of ASA metabolites in human plasma. (A), Metabolism of ASA. (B), Liquid chromatography–mass spectrometry (LC–MS) detection of ASA metabolite standards. (C), Experimental design. Human subjects were each given a single 325 mg dose of ASA, and blood was drawn both before (0 h) and either 4 (n = 5), 8 (n = 3), or 24 (n = 3) h later. Plasma was isolated from blood, and 0.5 mL was extracted for LC–MS analysis. (D), Plasma salicylate levels. Error bars indicate SEM. * p = 0.02, ** p = 0.001. (E), Plasma salicylurate levels. Error bars indicate SEM. * p = 0.07, ** p < 0.001. (F), Plasma gentisic acid levels. Error bars indicate SEM. * p = 0.03, ** p < 0.001. Note: ASA and salicyl acyl glucuronide were not detected in any of the samples.

