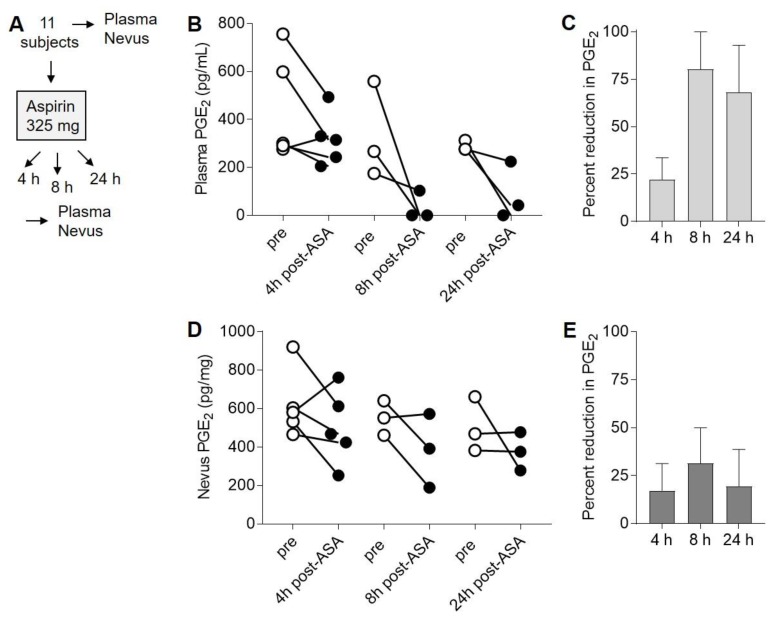
Figure 3.
Suppression of prostaglandin E2 (PGE2) in plasma and nevi following single dose of ASA. (A), Experimental design. Human subjects were each given a single 325 mg dose of ASA, and blood and nevus samples were obtained both before (pre) and either 4 (n = 5), 8 (n = 3), or 24 (n = 3) h later. (B), Plasma PGE2 levels before (open circles) and after (filled circles) aspirin treatment. (C), Average percent reduction in plasma PGE2 at each time point from (B). Error bars represent SEM. p = 0.09, ANOVA. (D), PGE2 levels in nevi taken before (open circles) and after (filled circles) ASA treatment. (E), Average percent reduction in nevus PGE2 at each time point from (D). Error bars represent SEM. p = 0.8, ANOVA. For the ANOVA analyses, the log ratio was first calculated for each subject, and then the log ratios were compared between groups.

