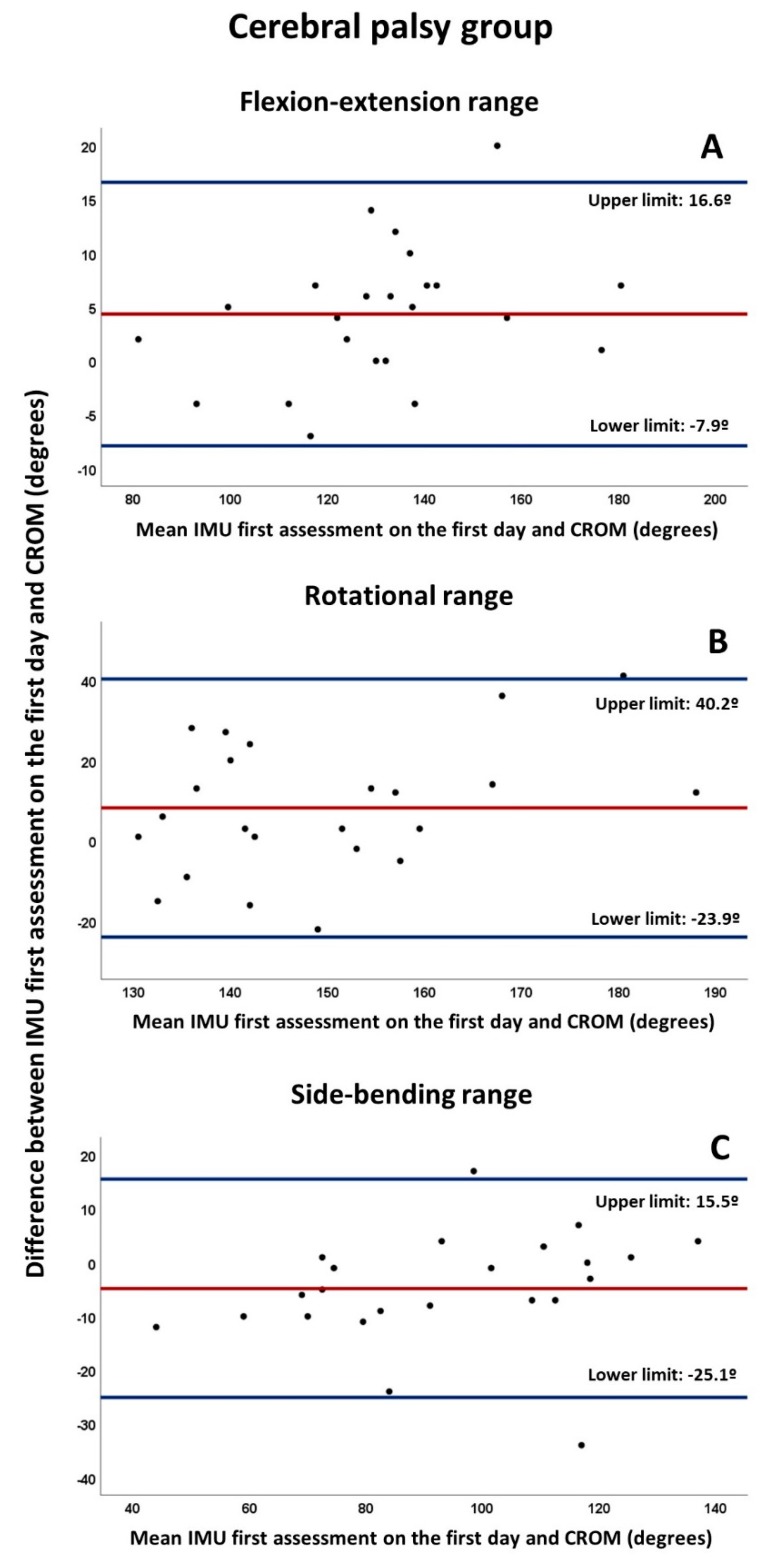
Figure 2.
Bland–Altman plots for craniocervical ranges of CP group measured by IMU first assessment on the first day and the CROM in (A) flexion-extension range, (B) rotational range, (C) side-bending range. The red line indicates the mean bias, whereas the blue lines refers to its upper and lower limits (mean ± 1.96 standard deviation). All plots were developed as follows: the Y axis corresponds to the differences between the paired values of both methods (IMU-CROM), whereas the X axis represents the respective value of the average of both (IMU + CROM/2).

