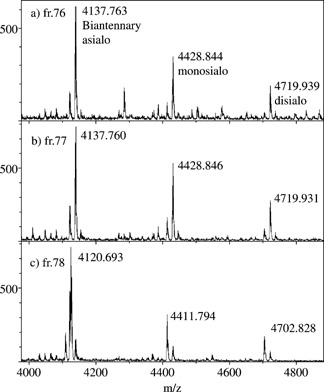
Figure 6.

Glycosylation profile of peptide QQQHLFGSNVTDCSGNFCLFR, i.e. residues 622–642 of human transferrin, according to order of elution in reversed‐phase HPLC. In (c), a global m/z decrease by 17 u denotes the formation of pyroglutamic acid at the N‐terminal of the peptide.22
