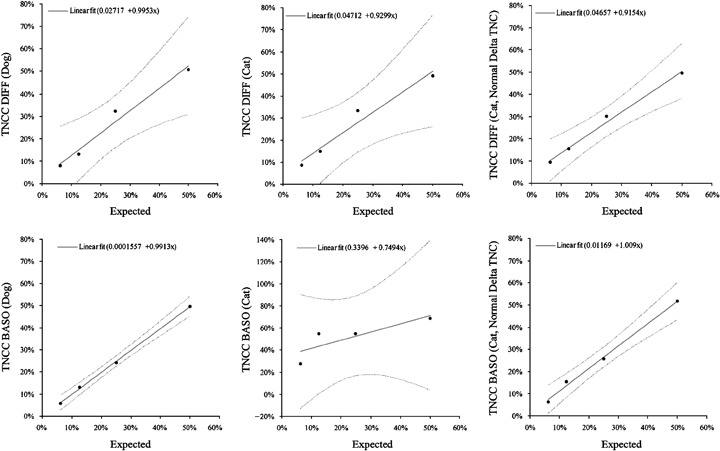
Figure 4.

Linearity of TNCC‐DIFF and TNCC‐BASO in effusion fluid from dogs and cats. Feline data also are shown after excluding samples with abnormal ΔTNC (graphs on right). Dotted lines indicate 95% confidence interval. TNC, total nucleated cells, TNCC, total nucleated cell count.
