

Abstract
Background and Objectives
The recent establishment of the National Healthcare Safety Network Hemovigilance Module in the United States affords an opportunity to compare results with those of other developed nations.
Materials and Methods
Using data from national haemovigilance systems, reactions associated with red blood cell (RBC) transfusion and residual risks of transfusion‐transmitted infectious diseases were assembled from 17 nations. Country‐specific rates of adverse events were pooled using random‐effects Poisson regression.
Results
Febrile non‐haemolytic and delayed serologic transfusion reactions were the most frequent adverse events reported after RBC transfusion, occurring in 26 patients per 100 000 RBC units and 25 patients per 100 000 RBC units administered, respectively. Rates of allergic, febrile non‐haemolytic and delayed haemolytic transfusion reactions in the United States were significantly greater than the pooled rates from other countries. Frequencies of adverse events generated from the national haemovigilance programme in the United States were considerably lower than when obtained through active surveillance.
Conclusion
Haemovigilance reports of adverse events in the United States are comparable to, or greater than, reports from other developed countries. Rates generated from haemovigilance programmes are lower than those obtained through active surveillance. The lack of universal leucoreduction of RBC units may be a contributing factor to the higher rate of some adverse events in the United States.
Keywords: adverse reaction, haemovigilance, international, transfusion
Introduction
First established in France and Japan in 1993 as a response to the vulnerability of the blood supply after the emergence of HIV 1, 2, haemovigilance systems aim to improve the safety of the blood supply through systematic surveillance of transfusion‐related adverse events. Such systems generate recommendations so as to encourage safety throughout the entire process, from blood donation through monitoring of recipients. Several directives from the European Union relate to the regulation, monitoring and safety of blood products, with the haemovigilance component helping to direct member nations’ reporting of serious transfusion‐related adverse reactions and events 3. Therefore, haemovigilance systems are widespread in European nations, with prime examples being the United Kingdom with its voluntary Serious Hazards of Transfusion reporting system (99·5% participation in 2013) 4, and the Netherlands with its Transfusion and Transplantation Reactions in Patients haemovigilance programme (98% participation in 2013) 5.
The USA opened its first nationwide haemovigilance system in 2010 as a voluntary module of the National Healthcare Safety Network 6. Results from this new system are now available and can be compared with existing haemovigilance programmes. As more nations begin to implement haemovigilance programmes, an assessment of the abilities of national systems to report reactions and a comparative review of event rates can be informative.
Methods
Haemovigilance data on transfusion‐related adverse reactions and transfusion‐transmitted infections were available from the national haemovigilance systems in each of the following countries: Australia 7, Canada 8, Denmark 9, Finland 10, France 11, Germany 12, Ireland 13, Japan 14, 15, 16, the Netherlands 5, New Zealand 17, Norway 18, Portugal 19, 20, Spain 21, Sweden 22, Switzerland 23, United Kingdom4 and the USA 6. Data regarding adverse events after RBC transfusion were collected: allergic reactions, anaphylactic reactions, febrile non‐haemolytic transfusion reactions (FNHTR), acute and delayed haemolytic transfusion reactions, hypotensive reactions, transfusion‐related acute lung injury (TRALI), transfusion‐associated dyspnoea, transfusion‐associated circulatory overload (TACO), delayed serologic transfusion reactions, post‐transfusion purpura and transfusion‐transmitted bacterial sepsis. Some countries reported additional categories and these were included as well (acute transfusion‐related pain, haemosiderosis). For each country, data from the most recently available report were utilized.
Risks of transfusion‐transmitted viruses were available for agents with mandated testing. Reporting methods differ by country, although in the USA, data regarding residual risk of viral transmission were derived from donor testing since long‐term follow‐up of recipients is not feasible 24. Because it is theoretically possible that a donor could have newly acquired a virus but is sero‐negative at the time of the blood donation, seroconversion rates during this infectious window period are used to predict the residual risk of viral infection 24.
Statistical analyses
Rates of non‐infectious adverse events were calculated for each country using the number of events (numerator) and the number of RBC units administered (denominator). Rates were reported for each country as events per 100 000 RBC units for non‐infectious adverse events and events per million RBC units for infectious adverse events. Canada and Spain were exceptions; adverse events were recorded for components combined (RBCs, platelets, plasma). In the USA, TACO was the only event in which reporting was performed for components combined (RBCs, platelets, plasma). In secondary analyses, adverse event rates from active surveillance in the USA were compared with the rates generated from the passive haemovigilance programme; in these instances, the rates were given using several denominators (per patient, per unit and per transfusion‐related hospital stay).
Following current recommendations for summarizing rates 25, random‐effects Poisson regression models were generated to pool rates of transfusion‐related adverse events with 95% confidence intervals. That is, the numbers of events were fit to a Poisson distribution with the number of RBC units included as an offset. Countries that reported zero events were included and, in such instances, a one‐sided exact Poisson 97·5% confidence interval was used for the country‐specific rate. Heterogeneity was assessed using a gamma density function (shape parameter = 2, scale = 0·5) for the variance of the random intercept (between‐country variance) in the Poisson model. This Rate Index of Heterogeneity (RIH) is unit‐independent, encompasses a range from 0% to 100% heterogeneity and is directly derived from the underlying random‐effects Poisson model for assessment of rates. Analyses were conducted using Stata/MP 13·1 (College Station, Texas, USA).
Results
Allergic reactions after RBC transfusion occurred in 11 patients per 100 000 RBC units administered (95% CI: 6·55/100 000 to 18·08/100 000) with a RIH of 58·5% (Fig. 1). The rate of allergic reactions in the USA was significantly greater (53·61/100 000; 95% CI: 49·59/100 000–57·87/100 000) than the pooled rate of the other developed countries combined (9·7/100 000; 95% CI: 5·93/100 000–15·85/100 000). Some countries reported anaphylactic reactions separately and these occurred at a lower rate of 0·9 per 100 000 RBC units (RIH = 17·1%). In the United Kingdom, acute transfusion reactions were defined as instances of anaphylaxis or severe allergic reactions, severe febrile reactions, severe hypotensive reactions and severe mixed reactions; these occurred at a rate of nine patients per 100 000 RBC units.
Figure 1.
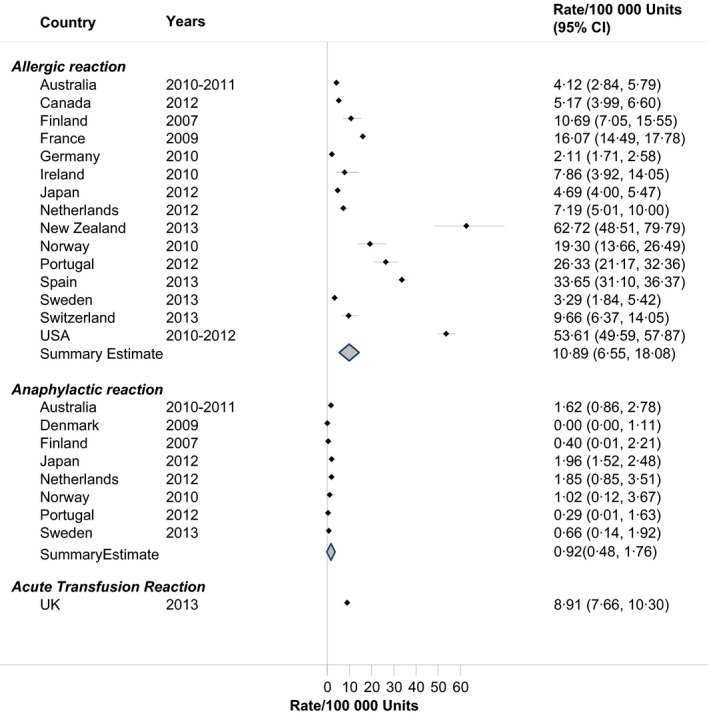
Rates of allergic reactions in haemovigilance reports, by Country.
There was variability in the rates of FNHTR across countries (RIH = 94·0%). Overall, the rate was 26 patients per 100 000 RBC units, although the Netherlands, New Zealand and the USA recorded rates in excess of 100 patients per 100 000 RBC units, or approximately one in one‐thousand units (Fig. 2). The rate of FNHTR in the USA was significantly greater (106·32/100 000; 95% CI: 100·63/100 000–112·25/100 000) than the pooled rate of the other developed countries combined (22·85/100 000; 95% CI: 9·74/100 000–53·63/100 000). Hypotensive reactions after RBC transfusion occurred less frequently, in 2 patients per 100 000 RBC units (RIH = 34·3%). In Spain, hypotensive reactions were combined with FNHTR, yielding a rate of 48 patients in 100 000 RBC units.
Figure 2.
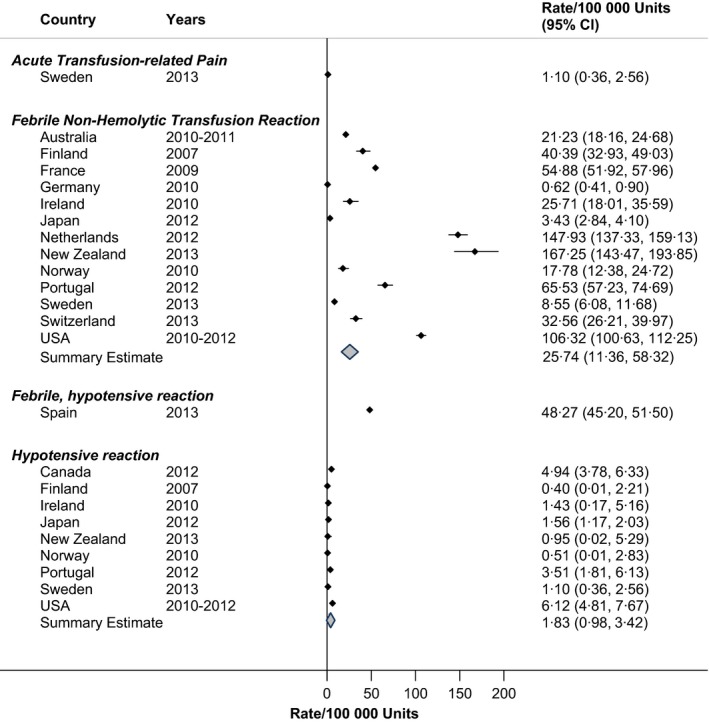
Rates of acute transfusion reactions in haemovigilance reports, by Country.
Acute transfusion‐related pain was reported separately in the Swedish haemovigilance system, occurring in one patient per 100 000 RBC units (Fig. 2).
Rates of acute and delayed haemolytic transfusion reactions are shown in Fig. 3. Acute haemolytic transfusion reactions occurred in 1 patient per 100 000 RBC units administered (RIH = 8·3%), while a delayed haemolytic transfusion reaction occurred in approximately two patients per 100 000 RBC units (RIH = 37·6%). In Germany, Spain and the United Kingdom, both acute and delayed haemolytic transfusion reactions were combined, yielding a pooled rate of 1·4/100 000 units (RIH = 57·0%). Both Ireland and the USA tended to have delayed haemolytic transfusion reactions at a greater frequency than other countries, although the confidence intervals for Ireland were wide indicating fewer RBC units due to a smaller population. The rate of delayed haemolytic transfusion reactions in the USA was significantly greater (6·94/100 000; 95% CI: 5·54/100 000–8·58/100 000) than the pooled rate of the other developed countries combined (1·6/100 000; 95% CI: 0·9/100 000–2·8/100 000).
Figure 3.
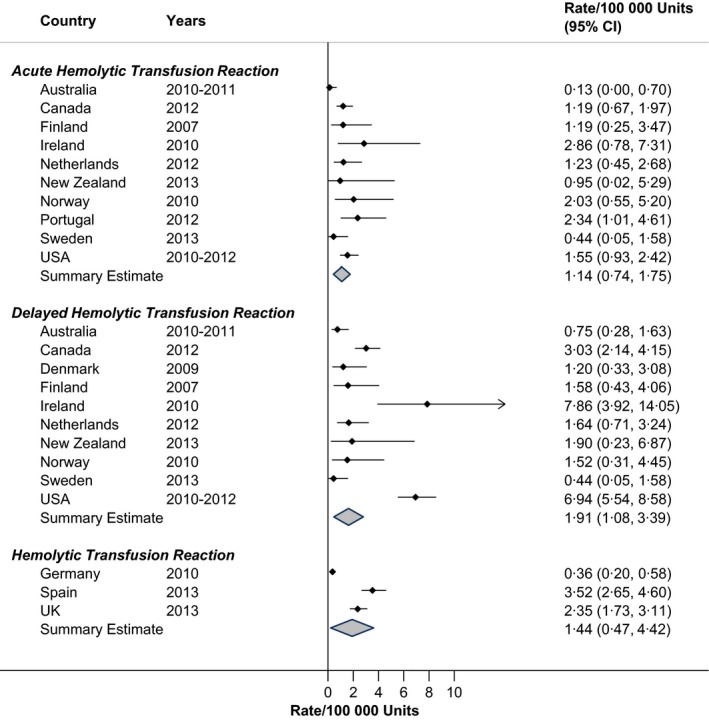
Rates of haemolytic reactions in haemovigilance reports, by Country.
Respiratory reactions to RBC transfusion are shown in Fig. 4. Transfusion‐associated dyspnoea was reported in two patients per 100 000 RBC units (RIH = 77·4%). New Zealand was an outlier in this category. TRALI associated with RBC units was quite low (Fig. 4), at a pooled rate of 0·35 per 100 000 RBC units (RIH = 73·2%).
Figure 4.
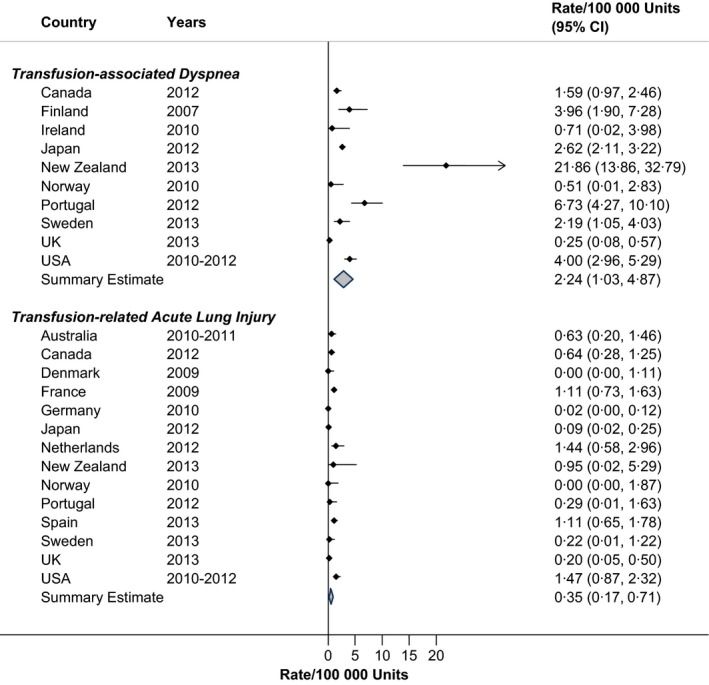
Rates of respiratory transfusion reactions in haemovigilance reports, by Country.
TACO occurred in approximately three patients for each 100 000 RBC units transfused, although there was some variation in rates across countries (Fig. 5; RIH = 76·9%). Haemosiderosis was reported separately in France and Spain and occurred at a rate of 0·3 for every 100 000 units transfused (RIH = 99·6%).
Figure 5.
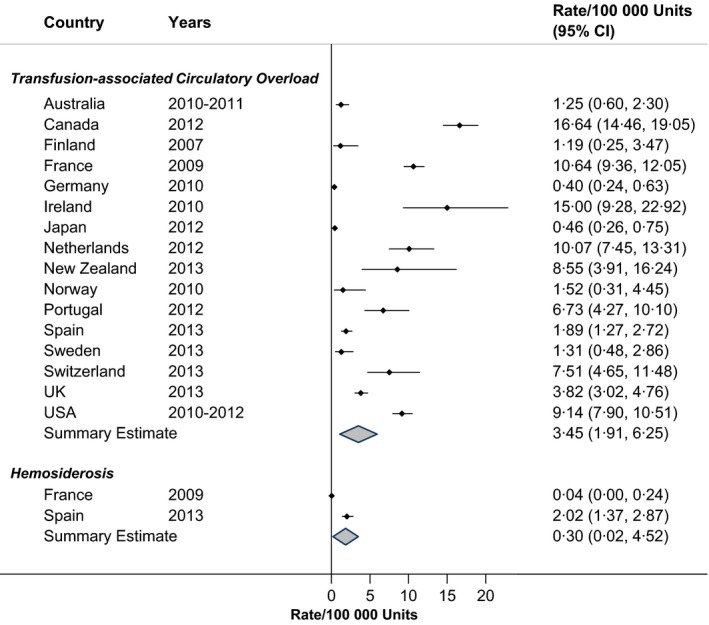
Rates of circulatory overload in haemovigilance reports, by Country.
The results for delayed serologic transfusion reactions are given in Fig. 6, showing heterogeneity across countries (RIH = 91·5%; rate = 24·6/100 000 units), with elevated rates in the Netherlands and Switzerland. Post‐transfusion purpura occurred rarely, at a rate of 0·08 per 100 000 RBC units administered (Fig. 6; RIH = 0%). Other transfusion‐related reactions, as shown in Fig. 6, varied by country and were not described in great detail in the country‐specific annual reports.
Figure 6.
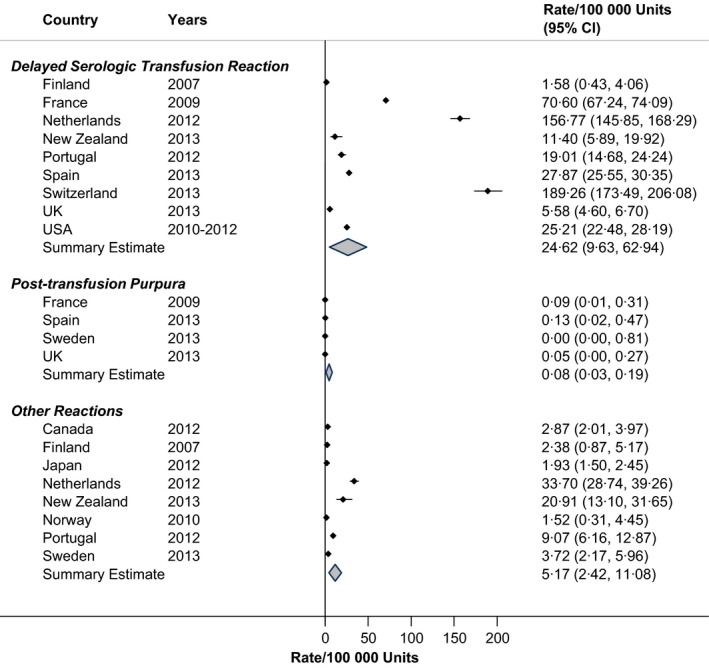
Rates of other transfusion reactions in haemovigilance reports, by Country.
Documented cases of transfusion‐transmitted bacterial sepsis occurred rarely, approximately once in every million RBC units administered (Fig. 7; RIH = 57·8%).
Figure 7.
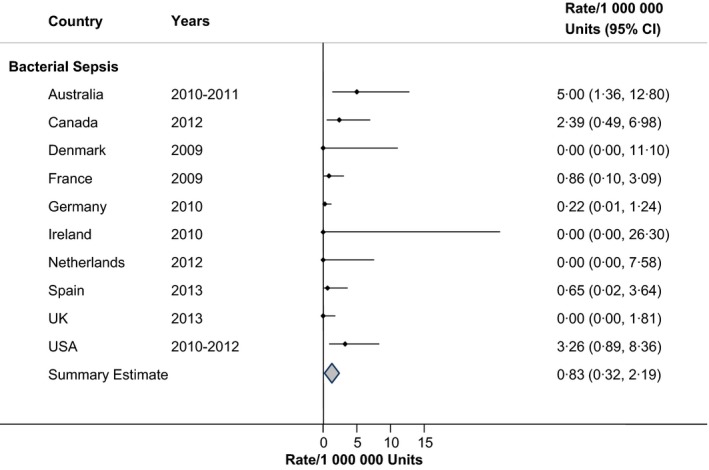
Rates of transfusion‐transmitted bacterial sepsis in haemovigilance reports, by Country.
Table 1 displays the estimate residual risk of viral transmission due to RBC transfusion. Rates were very low. HIV and hepatitis B and C viruses were most often monitored through haemovigilance, while data regarding other viruses (cytomegalovirus, Epstein–Barr, etc.) were available from only a few countries.
Table 1.
Risk of transfusion‐transmitted viruses in haemovigilance reports, by Country
| Virus | Country | Years | Rate |
|---|---|---|---|
| Cytomegalovirus | France | 2009 | 1 in 1·5 million |
| The Netherlands | 2012 | <1 in 620 000 | |
| Norway | 2004–2010 | 1 in 1·4 million | |
| Epstein–Barr Virus | The Netherlands | 2012 | <1 in 620 000 |
| Hepatitis A Virus | France | 2009 | <1 in 3 million |
| The Netherlands | 2012 | <1 in 620 000 | |
| Norway | 2004–2010 | 1 in 1·4 million | |
| Hepatitis B Virus | Australia | 2012–2013 | 1 in 720 000 |
| Canada | 2006–2009 | 1 in 1·7 million | |
| Denmark | 2009 | 1 in 270 000 | |
| Finland | 2007 | <1 in 450 000 | |
| France | 2009 | <1 in 3 million | |
| Germany | 2010 | 1 in 6·1 million | |
| Ireland | 2010–2011 | <1 in 190 000 | |
| Japan | 2012 | 1 in 880 000 | |
| The Netherlands | 2012 | <1 in 620 000 | |
| New Zealand | 2013 | 1 in 68 000 | |
| Spain | 2013 | 1 in 1·9 million | |
| Switzerland | 2013 | 1 in 400 000 | |
| UK | 2013 | 1 in 2·8 million | |
| USA | 2006–2008 | 1 in 300 000 | |
| Hepatitis C Virus | Australia | 2012–2013 | <1 in 1 million |
| Canada | 2006–2009 | 1 in 6·7 million | |
| Denmark | 2009 | <1 in 540 000 | |
| Finland | 2007 | <1 in 450 000 | |
| France | 2009 | <1 in 3 million | |
| Germany | 2010 | <1 in 6·1 million | |
| Ireland | 2010–2011 | <1 in 190 000 | |
| The Netherlands | 2012 | <1 in 620 000 | |
| Sweden | 2013 | <1 in 460 000 | |
| Switzerland | 2013 | 1 in 6·7 million | |
| UK | 2013 | <1 in 2·8 million | |
| USA | 2007–2008 | 1 in 1·1 million | |
| Hepatitis E Virus | France | 2009 | <1 in 3 million |
| Japan | 2012 | 1 in 1·3 million | |
| UK | 2013 | 1 in 2·8 million | |
| Human Immunodeficiency Virus | Australia | 2012–2013 | <1 in 1 million |
| Canada | 2006–2009 | 1 in 8 million | |
| Denmark | 2009 | <1 in 540 000 | |
| Finland | 2007 | <1 in 450 000 | |
| France | 2009 | <1 in 3 million | |
| Germany | 2010 | 1 in 6·1 million | |
| Ireland | 2010–2011 | <1 in 190 000 | |
| The Netherlands | 2012 | <1 in 620 000 | |
| New Zealand | 2013 | <1 in 140 000 | |
| Switzerland | 2013 | 1 in 4·1 million | |
| UK | 2013 | <1 in 2·8 million | |
| USA | 2007–2008 | 1 in 1·5 million | |
| Human T‐Lymphotropic Virus | Australia | 2012–2013 | <1 in 1 million |
| The Netherlands | 2012 | <1 in 620 000 | |
| USA | 2000–2001 | 1 in 2·1 million | |
| Parvovirus B19 | France | 2009 | 1 in 3 million |
| The Netherlands | 2012 | <1 in 620 000 | |
| Norway | 2004–2010 | 1 in 1·4 million | |
| Varicella Zoster Virus | Norway | 2004–2010 | 1 in 1·4 million |
This article is being made freely available through PubMed Central as part of the COVID-19 public health emergency response. It can be used for unrestricted research re-use and analysis in any form or by any means with acknowledgement of the original source, for the duration of the public health emergency.
Rates of adverse reactions in the USA, as generated through haemovigilance, were compared to documented rates obtained through active surveillance. Published frequency rates of TACO are shown in Table 2 26, 27, 28, 29, 30, 31, 32. When units were used as the denominator, the pooled rate of TACO was 368 per 100 000 units or one in every 271 units from active surveillance. This compares with one in 10942 units from passive surveillance through the haemovigilance programme in the USA.
Table 2.
Incidence of transfusion‐associated circulatory overload in the United States
| Author, year | Source | Type of study | Incidence | Incidence | Components | Year |
|---|---|---|---|---|---|---|
| Frequency per patient | ||||||
| Popovsky 26, 1996 | 5 Massachusetts hospitals, total hip or knee replacements | Retrospective cohort | 1·0% of patients | 1 in 95 patients | All | 1992–1993 |
| Bierbaum 27, 1999 | 235 hospitals, total hip or knee arthroplasty | Prospective cohort | 8·0% of patients | 1 in 12 patients | All | 1996–1997 |
| Rana 28, 2006 | Mayo Clinic, intensive care units | Prospective cohort | 1·85% of patients | 1 in 54 patients | All | 2003 |
| Li 29, 2011 | Mayo Clinic, medical intensive care unit | Prospective cohort | 5·7% of patients | 1 in 18 patients | All | 2 years, before 2007 |
| Andrzejewski 30, 2012 | Hospital in Massachusetts, all ages | Retrospective cohort | 0·6% of patients | 1 in 166 patients | RBCs | 2005–2008 |
| Clifford 31, 2015 | Mayo Clinic, adults, non‐cardiac surgery | Retrospective cohort | 5·5% of patients | 1 in 18 patients | All | 2004 |
| 3·0% of patients | 1 in 33 patients | All | 2011 | |||
| Frequency per unit: | ||||||
| Rana 28, 2006 | Mayo Clinic, intensive care units | Prospective cohort | 281/100 000 units | 1 in 356 units | All | 2003 |
| Andrzejewski 30, 2012 | Hospital in Massachusetts, all ages | Retrospective cohort | 189/100 000 units | 1 in 530 units | RBCs | 2005–2008 |
| Harvey 6, 2014 | National Healthcare Safety Network, 77 facilities | Voluntary haemovigilance | 9/100 000 units | 1 in 10942 units | All | 2010–2012 |
| Clifford 31, 2015 | Mayo Clinic, adults, non‐cardiac surgery | Retrospective cohort | 4000/100 000 units | 1 in 25 units | RBCs | 2004 |
| 1087/100 000 units | 1 in 92 units | RBCs | 2011 | |||
| Frequency per hospital stay | ||||||
| Menis 32, 2014 | Medicare administrative database | Retrospective | 0·06% of stays | 1 in 1602 stays | All | 2011 |
This article is being made freely available through PubMed Central as part of the COVID-19 public health emergency response. It can be used for unrestricted research re-use and analysis in any form or by any means with acknowledgement of the original source, for the duration of the public health emergency.
In general, rates of FNHTR were lower in leucoreduced versus non‐leucoreduced products within the same population (Table 3) 33, 34, 35, 36, 37, 38, 39, 40, 41, 42, 43, 44. With prospective surveillance, the pooled rate of FNHTR was 1191/100 000 units or one in every 84 units; this compares with one case in 3885 RBC units from haemovigilance. The rates tended to be greater in children than adults; one in 20 children who received a transfusion developed FNHTR (all component types combined). FNHTR rates also appeared higher in patients with cancer.
Table 3.
Incidence of febrile non‐haemolytic transfusion reaction in the United States
| Author, year | Source | Type of study | Incidence | Incidence | Components | Year |
|---|---|---|---|---|---|---|
| Frequency per patient | ||||||
| Paglino 33, 2004 | Yale‐New Haven Hospital, Connecticut, all ages | Retrospective cohort | 1·33% of patients | 1 in 75 patients | 25% leucoreduced RBCs | 1995–1998 |
| 0·79% of patients | 1 in 127 patients | 99% leucoreduced RBCs | 2000–2002 | |||
| Sanders 34, 2005 | St. Jude Children's Research Hospital | Retrospective cohort | 4·94% of children | 1 in 20 children | All | 2002 |
| Kennedy 35, 2008 | Wake Forest University, Comprehensive Cancer Center | Prospective active surveillance | 8·70% of patients | 1 in 11 patients | RBCs and PLTs, leucoreduced | 1993–1997 |
| Frequency per unit | ||||||
| Menitove 36, 1982 | 33 Hospitals in South‐eastern Wisconsin, all ages | Retrospective cohort | 478/100 000 units | 1 in 209 units | RBCs and whole blood | 1980 |
| Dzieczkowski 37, 1995 | Dana‐Farber Cancer Institute, Boston, Massachusetts | Prospective cohort | 2147/100 000 units | 1 in 47 units | RBCs, leucoreduced after storage | 1993 |
| Federowicz 38, 1996 | Dana‐Farber Cancer Institute, Boston, Massachusetts | Prospective cohort | 1109/100 000 units | 1 in 90 units | RBCs, leucoreduced before storage | Before 1995 |
| Uhlman 39, 2001 | Barnes‐Jewish Hospital, St. Louis, Missouri | Retrospective cohort | 124/100 000 units | 1 in 809 units | Non‐leucoreduced RBCs | 1999 |
| 81/100 000 units | 1 in 1238 units | Leucoreduced RBCs | 2000 | |||
| Domen 40, 2003 | Cleveland Clinic, Ohio, all ages | Retrospective cohort | 30/100 000 units | 1 in 3293 units | RBCs | 1993–2001 |
| Paglino 33, 2004 | Yale‐New Haven Hospital, Connecticut, all ages | Retrospective cohort | 340/100 000 units | 1 in 294 units | 25% leucoreduced RBCs | 1995–1998 |
| 180/100 000 units | 1 in 556 units | 99% leucoreduced RBCs | 2000–2002 | |||
| King 41, 2004 | The Johns Hopkins Hospital, all ages | Retrospective cohort | 369/100 000 units | 1 in 271 units | 4% leucoreduced RBCs | 1994 |
| 186/100 000 units | 1 in 538 units | 99·5% leucoreduced RBCs | 2001 | |||
| Ezidiegwu 42, 2004 | State University of New York, Syracuse, adults, nonsurgical | Retrospective cohort | 162/100 000 units | 1 in 619 units | RBCs | 1998–2000 |
| 79/100 000 units | 1 in 1259 units | Leucoreduced RBCs | 2001–2002 | |||
| Sanders 34, 2005 | St. Jude Children's Research Hospital | Retrospective cohort | 360/100 000 units in children | 1 in 278 units in children | RBCs | 2002 |
| Kennedy 35, 2008 | Wake Forest University, Comprehensive Cancer Center | Prospective active surveillance | 639/100 000 units | 1 in 156 units | RBCs and PLTs, leucoreduced | 1993–1997 |
| Harvey 6, 2014 | National Healthcare Safety Network, 77 facilities | Voluntary haemovigilance | 106/100 000 units | 1 in 941 units | RBCs | 2010–2012 |
| Oakley 43, 2015 | Vanderbilt University Medical Center, all ages | Retrospective cohort | 184/100 000 units in children | 1 in 545 units in children | Leucoreduced RBCs | 2011–2013 |
| 36/100 000 units in adults | 1 in 2775 units in adults | Leucoreduced RBCs | 2011–2013 | |||
| Frequency per hospital stay | ||||||
| Menis 44, 2015 | Medicare administrative database | Retrospective | 0·07% of stays | 1 in 1419 stays | RBCs | 2011–2012 |
This article is being made freely available through PubMed Central as part of the COVID-19 public health emergency response. It can be used for unrestricted research re-use and analysis in any form or by any means with acknowledgement of the original source, for the duration of the public health emergency.
Discussion
Haemovigilance systems in developed nations report low rates of adverse events after RBC transfusion. For anaphylaxis, hypotension and purpura, the rates were quite consistent across countries. Rates of some reactions, however, were notably elevated in particular countries. Rates of allergic reactions were higher in the USA and New Zealand; rates of FNHTR were elevated in the USA, the Netherlands and New Zealand; and TACO was more commonly reported in Canada, France, Ireland, the Netherlands and the USA. New Zealand reported a greater rate of transfusion‐associated dyspnoea in 2013. However, in a recent report, more than half of the dyspnoea cases were reclassified when additional information was retrieved (many being reclassified as TACO) 45.
Overall, TACO occurred at a rate of three cases per 100 000 units when pooled from haemovigilance reports, with the incidence of TACO in the USA alone being one in 10942 units. However, based on active surveillance studies from the USA, 0·6% to 8% of patients receiving RBC transfusions develop TACO. This disparity between active and passive surveillance rates may stem from insufficient reporting of reactions to haemovigilance systems. For example, researchers from the Mayo Clinic noted that there were 176 cases of TACO in their investigation but only three were in the transfusion database that housed adverse reactions – and even then, these three cases were not labelled as TACO 31.
Given the more comprehensive monitoring of fever after RBC transfusion, the variability of rates of FNHTR across countries may be a reflection of dissimilarities in patient populations, differential use of pretransfusion antipyretic medications or the preparation of RBC units. Of note, the USA has not adopted universal leucoreduction (70·5% RBC units leucoreduced in 2011)46 and FNHTR has been reported more frequently in patients receiving non‐leucoreduced products 33, 39, 41, 42, 47. FNHTR rates in the USA are higher than the pooled FNHTR rates in other developed countries and the use of non‐leucoreduced products could partially account for these findings.
The variability in rates of allergic reactions across nations may stem from differences in case definitions. In Australia, for example, a severe allergic reaction would be recorded if rash, allergic dyspnoea, angioedema, generalized pruritis or uticaria occurred within 24 h of the transfusion 7. In the USA, a severe allergic reaction would be recorded if two or more symptoms (conjunctival oedema; oedema of lips, tongue and uvula; erythema and oedema of the periorbital area; generalized flushing; hypotension; localized angioedema; maculopapular rash; pruritus; respiratory distress or bronchospasm; urticaria) occurred during or within 4 h of the cessation of transfusion 48. Moreover, in some countries such as New Zealand, both non‐severe and severe allergic reactions are reported17 (perhaps reflecting their higher rates as shown in Fig. 1) while in the USA, reporting of non‐severe allergic reactions is not required 48. Other reasons for differences in rates may be variations in hospital‐specific reporting practices and the mandatory/voluntary nature of the reporting.
For events such as delayed serologic transfusion reaction and delayed haemolytic transfusion reaction, the definition hinges on laboratory testing and not symptoms. Rate differences may be a reflection of the resources afforded for testing of alloantibodies and the feasibility of longitudinal observation. Information regarding follow‐up procedures or standardization of procedures would enhance the interpretability of rates. Alternatively, haemovigilance programmes may reconsider the usefulness of expending resources to capture such data when the likelihood of consistent, meaningful information is low. Perhaps periodic systematic testing in high users of transfusion would be more appropriate such as in patients with sickle‐cell disease or cancer, or in participants of cardiovascular disease registries.
Results from this investigation indicate that the residual risks from currently tested infectious agents are very low and, in many instances, could be considered negligible. However, it is the potential risks from other infectious agents (not yet tested) which are more pertinent at this time. These include vCJD, hepatitis E virus, dengue viruses, chikungunya virus, Babesia spp., West Nile virus and Middle East respiratory syndrome coronavirus – although the list of potential threats includes approximately 70 such agents 49. For example, in the USA, transfusion‐transmitted babesiosis has been documented in more than 200 instances and is associated with the greatest case fatality rate of transfusion‐related infections 50.
Haemovigilance for transfusion‐transmitted infection is meant to capture pathogen transmission from donor to recipient. The requirements include the demonstration of the pathogen in the transfused component, or in the donor at the time of donation, or in an additional component from the same donation, or in an additional recipient of a component from the same donation 48. Also required is documentation that there are no other potential exposures to the pathogen that could be identified in the recipient and either evidence that the recipient was not infected with the pathogen prior to transfusion or evidence that the pathogen strains are related by molecular or extended phenotypic comparison testing 48. This is a difficult target to reach when such in‐depth testing is not usually conducted with each transfusion. Therefore, the pooled rate of transfusion‐transmitted bacterial sepsis was very low (0·83/1 million RBC units). There are few published reports of prospective surveillance for comparison purposes. Barrett and colleagues51 found a bacterial contamination rate of 3·2/100 000 RBC units, while Dzieczkowski and colleagues37 reported this rate to be 14·1/100 000 RBC units. In a more recent report from Denmark, 35% of RBC units contained viable bacteria which were obtained from donors 50 years of age or older 52.
There are avenues for improvement in existing haemovigilance systems. The addition of active surveillance components may enhance reporting. Expansion of electronic medical records to incorporate more information regarding blood administration may augment comprehensiveness. Adjunct programming routines could be enacted to capture pre‐ and post‐transfusion temperatures so that detection of FNHTR could be improved. Likewise, electronic capture of pre‐ and post‐transfusion blood pressures could assist the detection of hypotensive reactions. Some have already merged records from transfusion and apheresis medicine with the main electronic medical record 53, 54, 55. The SCANDAT2 is a successful example of linked donor and recipient health information in Sweden and Denmark 55. In addition, international networks (e.g. International Haemovigilance Network 56, Global Vigilance and Surveillance Database for Medical Products of Human Origin 57, World Health Organization Global Database on Blood Safety58) provide opportunities for surveillance and the improvement of blood safety.
National haemovigilance programmes afford an important aspect of patient safety. Such systems generally capture serious transfusion reactions but, with improvement, could generate more comprehensive information. Cross‐country comparisons can provide the basis for discovery and continuous process improvement.
Acknowledgements
All authors contributed to the design, analysis or data interpretation; made critical revisions of the manuscript; and approved the submitted final version.
References
- 1. Salmi LR, Hervé P: L'organisation de l'hémovigilance en France. TCB 1994; 3:252–256 [DOI] [PubMed] [Google Scholar]
- 2. Tadokoro K: The new Japanese blood law: its impact on blood safety and usage. Dev Biol (Basel) 2007; 127:161–168 [PubMed] [Google Scholar]
- 3. Folléa G, Aranko K: European Blood Alliance: The revision of the European blood directives: a major challenge for transfusion medicine. Transfus Clin Biol 2015; S1246–7820:00032–00034 [DOI] [PubMed] [Google Scholar]
- 4. Bolton‐Maggs P, Working Expert Group & Writing Group, Royal College of Pathologists: Annual SHOT Report: Serious Hazards of Transfusion (SHOT) 2013. Available at: http://www.shotuk.org/wp-content/uploads/74280-SHOT-2014-Annual-Report-V12-WEB.pdf (accessed July 9th, 2015)
- 5. TRIP Hemovigilance and biovigilance office: TRIP annual report: Hemovigilance extended version, 2012. Available at: http://www.tripnet.nl/pages/en/documents/TRIP2012Hemovigilantie_ENGELS4.pdf (accessed July 9th, 2015)
- 6. Harvey AR, Basavaraju SV, Chung KW, et al: Transfusion‐related adverse reactions reported to the National Healthcare Safety Network Hemovigilance Module, United States, 2010 to 2012. Transfusion 2015; 55:709–718 [DOI] [PMC free article] [PubMed] [Google Scholar]
- 7. National Blood Authority: Australian Haemovigilance Report: data for 2009‐10 and 2010‐11. Available at: http://www.blood.gov.au/haemovigilance-reporting (accessed July 9th, 2015)
- 8. Public Health Agency of Canada: Transfusion transmitted injuries surveillance system (TTISS): summary results for 2006‐2012. Available at: http://www.phac-aspc.gc.ca/hcai-iamss/ttiss-ssit/index-eng.php (accessed July 9th, 2015)
- 9. Taaning EM, Sorensen B, Riisom K: Danish Registration of Transfusion Risk (DART) hemovigilance report for 2009. Available at: http://dski.dk/files/DART_2009.pdf (accessed July 9th, 2015)
- 10. Finnish Red Cross Blood Service: Adverse transfusion events in Finland 2007. Available at: http://www.hemovigilans.se/downloads/BSO_2007.pdf (accessed July 9th, 2015)
- 11. French Agency for the Safety of Health Products: Annual Haemovigilance report 2009. Available at: http://ansm.sante.fr/var/ansm_site/storage/original/application/bb2a6b52bdb935954bd985d638e0e734.pdf (accessed July 9th, 2015)
- 12. Lohmann A, Halbauer J, Witzenhausen C, et al: Haeomovigilance report of the Paul‐Ehrlich Institute: Assessment of the reports of serious adverse transfusion reactions, 2010. Available at: http://www.pei.de/SharedDocs/Downloads/vigilanz/haemovigilanz/publikationen/haemovigilance-report-2010.pdf?__blob=publicationFile&v=3(accessed July 9th, 2015)
- 13. National Haemovigilance Office: NHO Report 2010/2011, Ireland. Available at: http://www.giveblood.ie/Clinical_Services/Haemovigilance/Publications/NHO-Annual-Report-2011.pdf(accessed July 9th, 2015)
- 14. Japanese Red Cross Society: Non‐hemolytic adverse transfusion reactions reported to JRC Blood Centers, 2012. Available at: http://www.jrc.or.jp/mr/english/(accessed July 9th, 2015)
- 15. Japanese Red Cross Society: Transfusion‐related acute lung injury, 2012. Available at: http://www.jrc.or.jp/mr/english/(accessed July 9th, 2015)
- 16. Japanese Red Cross Society: Infectious cases of probably related to transfused blood components, 2012. Available at: http://www.jrc.or.jp/mr/english/(accessed July 9th, 2015)
- 17. Badami K, Buhrkuhl D, Sadani D, et al: National Haemovigilance Group. National haemovigilance programme, Annual report, 2013. Available at: http://www.nzblood.co.nz/assets/Haemovigilance/Haemovigilance-Annual-Report-2013.pdf(accessed July 9th, 2015)
- 18. Norwegian Knowledge Centre for the Health Services: Monitoring of Blood: haemovigilance report, 2010. Available at: http://www.kunnskapssenteret.no/en/publications/surveillance-of-blood-in-norway-2010.troll.adverse-outcomes-of-transfusion(accessed July 9th, 2015)
- 19. De Sousa G, Miranda I, Pires I, et al: Report of the Portuguese Haemovigilance System, 2012. Available at: http://www.hemovigilancia.net/docs/relatorio_sphv_2012.pdf(accessed July 9th, 2015)
- 20. De Sousa G, Miranda I, Pires I, et al: Activity report of the services of blood and transfusion medicine, 2012. Available at: http://www.hemovigilancia.net/docs/relatorio_atividade_ss_smt_2012.pdf (accessed July 9th, 2015)
- 21. Hemovigilance Unit, Public Health, Quality and Innovation: Hemovigilance, Spain, 2013. Available at: http://www.msssi.gob.es/profesionales/saludPublica/medicinaTransfusional/hemovigilancia/docs/Informe2013.pdf(accessed July 9th, 2015)
- 22. Säfwenberg J, Palfi M: Report from the BIS ‐ Blood Monitoring in Sweden. Hemovigilance in Sweden 2011‐2013. Available at: http://www.kitm.se/sv/wp-content/uploads/2014/10/Hemovigilans-i-Sverige-2011-2013.pdf(accessed July 9th, 2015)
- 23. Jutzi M, Amsler L. Swissmedic Haemovigilance Annual report, Switzerland, 2013. Available at: https://www.swissmedic.ch/marktueberwachung/00138/00188/index.html?lang=en&download=NHzLpZeg7t,lnp6I0NTU042l2Z6ln1ad1IZn4Z2qZpnO2Yuq2Z6gpJCDdoN5e2ym162epYbg2c_JjKbNoKSn6A-(accessed July 9th, 2015)
- 24. Schreiber G, Busch MP, Kleinman SH, et al: The risk of transfusion‐transmitted viral infections. The Retrovirus Epidemiology Donor Study. N Engl J Med 1996; 334:1685–1690 [DOI] [PubMed] [Google Scholar]
- 25. Trikalinos TA, Trow P, Schmid CH: Simulation‐Based Comparison of Methods for Meta‐Analysis of Proportions and Rates. AHRQ Publication No. 13(14)‐EHC084‐EF. November 2013. Available at: http://www.ncbi.nlm.nih.gov/books/NBK179162/(accessed July 9th, 2015) [PubMed]
- 26. Popovsky MA, Audet AM, Andrzejewski C Jr: Transfusion‐associated circulatory overload in orthopedic surgery patients: a multi‐institutional study. Immunohematology 1996; 12:87–89 [PubMed] [Google Scholar]
- 27. Bierbaum BE, Callaghan JJ, Galante JO, et al: An analysis of blood management in patients having a total hip or knee arthroplasty. J Bone Joint Surg Am 1999; 81:2–10 [DOI] [PubMed] [Google Scholar]
- 28. Rana R, Fernández‐Pérez ER, Khan SA, et al: Transfusion‐related acute lung injury and pulmonary edema in critically ill patients: a retrospective study. Transfusion 2006; 46:1478–1483 [DOI] [PubMed] [Google Scholar]
- 29. Li G, Rachmale S, Kojicic M, et al: Incidence and transfusion risk factors for transfusion‐associated circulatory overload among medical intensive care unit patients. Transfusion 2011; 51:338–343 [DOI] [PMC free article] [PubMed] [Google Scholar]
- 30. Andrzejewski C Jr, Popovsky MA, Stec TC, et al: Hemotherapy bedside biovigilance involving vital sign values and characteristics of patients with suspected transfusion reactions associated with fluid challenges: can some cases of transfusion‐associated circulatory overload have proinflammatory aspects? Transfusion 2012; 52:2310–2320 [DOI] [PubMed] [Google Scholar]
- 31. Clifford L, Jia Q, Yadav H, et al: Characterizing the epidemiology of perioperative transfusion‐associated circulatory overload. Anesthesiology 2015; 122:21–28 [DOI] [PMC free article] [PubMed] [Google Scholar]
- 32. Menis M, Anderson SA, Forshee RA, et al: Transfusion‐associated circulatory overload (TACO) and potential risk factors among the inpatient US elderly as recorded in Medicare administrative databases during 2011. Vox Sang 2014; 106:144–152 [DOI] [PubMed] [Google Scholar]
- 33. Paglino JC, Pomper GJ, Fisch GS, et al: Reduction of febrile but not allergic reactions to RBCs and platelets after conversion to universal prestorage leukoreduction. Transfusion 2004; 44:16–24 [DOI] [PubMed] [Google Scholar]
- 34. Sanders RP, Maddirala SD, Geiger TL, et al: Premedication with acetaminophen or diphenhydramine for transfusion with leucoreduced blood products in children. Br J Haematol 2005; 130:781–787 [DOI] [PubMed] [Google Scholar]
- 35. Kennedy LD, Case LD, Hurd DD, et al: A prospective, randomized, double‐blind controlled trial of acetaminophen and diphenhydramine pretransfusion medication versus placebo for the prevention of transfusion reactions. Transfusion 2008; 48:2285–2291 [DOI] [PubMed] [Google Scholar]
- 36. Menitove JE, McElligott MC, Aster RH: Febrile transfusion reaction: what blood component should be given next? Vox Sang 1982; 42:318–321 [DOI] [PubMed] [Google Scholar]
- 37. Dzieczkowski JS, Barrett BB, Nester D, et al: Characterization of reactions after exclusive transfusion of white cell‐reduced cellular blood components. Transfusion 1995; 35:20–25 [DOI] [PubMed] [Google Scholar]
- 38. Federowicz I, Barrett BB, Andersen JW, et al: Characterization of reactions after transfusion of cellular blood components that are white cell reduced before storage. Transfusion 1996; 36:21–28 [DOI] [PubMed] [Google Scholar]
- 39. Uhlmann EJ, Isgriggs E, Wallhermfechtel M, et al: Prestorage universal WBC reduction of RBC units does not affect the incidence of transfusion reactions. Transfusion 2001; 41:997–1000 [DOI] [PubMed] [Google Scholar]
- 40. Domen RE, Hoeltge GA: Allergic transfusion reactions: an evaluation of 273 consecutive reactions. Arch Pathol Lab Med 2003; 127:316–320 [DOI] [PubMed] [Google Scholar]
- 41. King KE, Shirey RS, Thoman SK, et al: Universal leukoreduction decreases the incidence of febrile nonhemolytic transfusion reactions to RBCs. Transfusion 2004; 44:25–29 [DOI] [PubMed] [Google Scholar]
- 42. Ezidiegwu CN, Lauenstein KJ, Rosales LG, et al: Febrile nonhemolytic transfusion reactions. Management by premedication and cost implications in adult patients. Arch Pathol Lab Med 2004; 128:991–995 [DOI] [PubMed] [Google Scholar]
- 43. Oakley FD, Woods M, Arnold S, et al: Transfusion reactions in pediatric compared with adult patients: a look at rate, reaction type, and associated products. Transfusion 2015; 55:563–570 [DOI] [PubMed] [Google Scholar]
- 44. Menis M, Forshee RA, Anderson SA, et al: Febrile non‐haemolytic transfusion reaction occurrence and potential risk factors among the U.S. elderly transfused in the inpatient setting, as recorded in Medicare databases during 2011‐2012. Vox Sang 2015; 108:251–261 [DOI] [PubMed] [Google Scholar]
- 45. Badami KG, Joliffe E, Stephens M: Transfusion‐associated dyspnoea ‐ shadow or substance? Vox Sang 2015; 109:197–200. [DOI] [PubMed] [Google Scholar]
- 46. Whitaker BI, Hinkins S: The 2011 National Blood Collection and Utilization Survey Report. US Department of Health and Human Services, 2011. [Google Scholar]
- 47. Blumberg N, Heal JM, Gettings KF, et al: An association between decreased cardiopulmonary complications (transfusion‐related acute lung injury and transfusion‐associated circulatory overload) and implementation of universal leukoreduction of blood transfusions. Transfusion 2010; 50:2738–2744 [DOI] [PMC free article] [PubMed] [Google Scholar]
- 48. Centers for Disease Control and Prevention: National Healthcare Safety Network, Biovigilance Component, Hemovigilance Module, Surveillance Protocol, v2.1.3, 2014. Available at: http://www.cdc.gov/nhsn/PDFs/Biovigilance/BV-HV-protocol-current.pdf (accessed July 9th, 2015)
- 49. Stramer SL: Current perspectives in transfusion‐transmitted infectious diseases: emerging and re‐emerging infections. ISBT Sci Ser 2014; 9:30–36 [DOI] [PMC free article] [PubMed] [Google Scholar]
- 50. Blood Products Advisory Committee , Food and Drug Administration : Strategies for implementation of antibody and nucleic acid‐based testing for Babesia microti in blood donors, 2015: Available at: http://www.fda.gov/downloads/advisorycommittees/committeesmeetingmaterials/bloodvaccinesandotherbiologics/bloodproductsadvisorycommittee/ucm446274.pdf (accessed July 9th, 2015)
- 51. Barrett BB, Anderson JW, Anderson KC: Strategies for the avoidance of bacterial contamination of blood components. Transfusion 1993; 133:228–233 [DOI] [PubMed] [Google Scholar]
- 52. Damgaard C, Magnussen K, Enevold C, et al: Viable bacteria associated with red blood cells and plasma in freshly drawn blood donations. PLoS ONE 2015; 10:e0120826 [DOI] [PMC free article] [PubMed] [Google Scholar]
- 53. Levy R, Pantanowitz L, Cloutier D, et al: Development of electronic medical record charting for hospital‐based transfusion and apheresis medicine services: Early adoption perspectives. J Pathol Inform 2010; 1. pii:8 [DOI] [PMC free article] [PubMed] [Google Scholar]
- 54. Clifford L, Singh A, Wilson GA, et al: Electronic health record surveillance algorithms facilitate the detection of transfusion‐related pulmonary complications. Transfusion 2013; 53:1205–1216 [DOI] [PMC free article] [PubMed] [Google Scholar]
- 55. Edgren G, Rostgaard K, Vasan SK, et al: The new Scandinavian Donations and Transfusions database (SCANDAT2): a blood safety resource with added versatility. Transfusion 2015; 55:1600–1606 [DOI] [PubMed] [Google Scholar]
- 56. International Haemovigilance Network . ISTARE. Available at: http://www.ihn-org.com/haemovigilance-databases/istare-2/ (accessed September 29th, 2015)
- 57. The Global Vigilance and Surveillance Database for Medical Products of Human Origin. NOTIFY Library. Available at: http://www.notifylibrary.org/(accessed September 29th, 2015)
- 58. World Health Organization . Global Database on Blood Safety. Available at: http://www.who.int/bloodsafety/global_database/en/ (accessed September 29th, 2015)