
Figure 7.
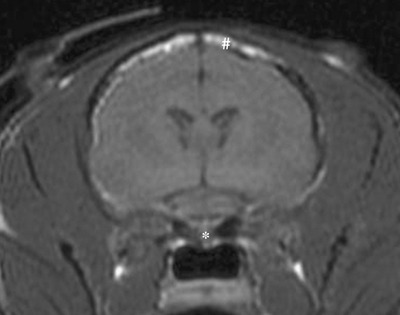
Transverse T1W MR image through the skull of the Domestic Long Haired cat at the level of the optic chiasm showing enlarged sphenoid bones (*), which are hypointense compared with normal fatty bone marrow as seen in the frontal bone (#).
Official websites use .gov
A
.gov website belongs to an official
government organization in the United States.
Secure .gov websites use HTTPS
A lock (
) or https:// means you've safely
connected to the .gov website. Share sensitive
information only on official, secure websites.
Transverse T1W MR image through the skull of the Domestic Long Haired cat at the level of the optic chiasm showing enlarged sphenoid bones (*), which are hypointense compared with normal fatty bone marrow as seen in the frontal bone (#).