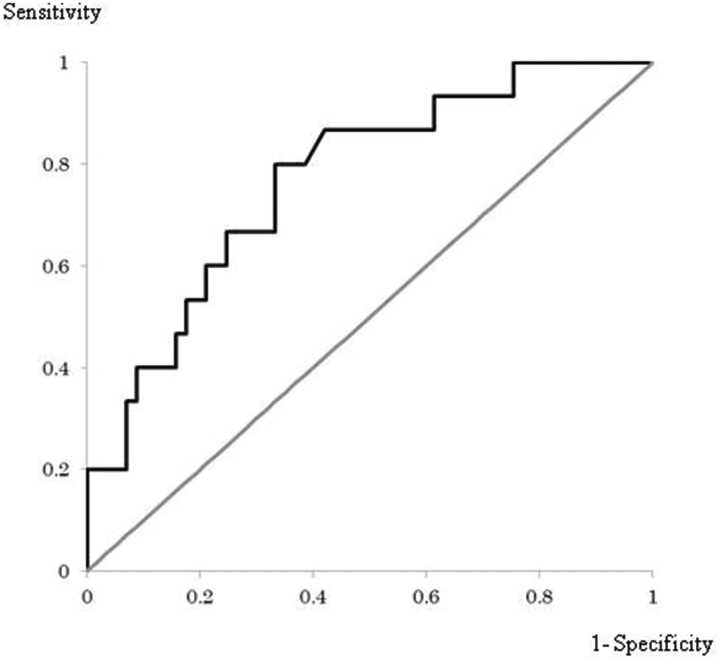
Figure 1.
An ROC curve using mean values of positive Z-scores in the target volume of interest (VOI; obtained using the voxel-based specific regional analysis system for Alzheimer’s disease) as the variable of interest and Alzheimer’s disease diagnosis as the classification variable. The area under the curve was 0.770, and a sensitivity of 0.80, specificity of 0.67, and accuracy of 69.4% were obtained with a cut-off value of 1.57 for the mean value of positive Z-scores in the target VOI.

