
Figure 3.
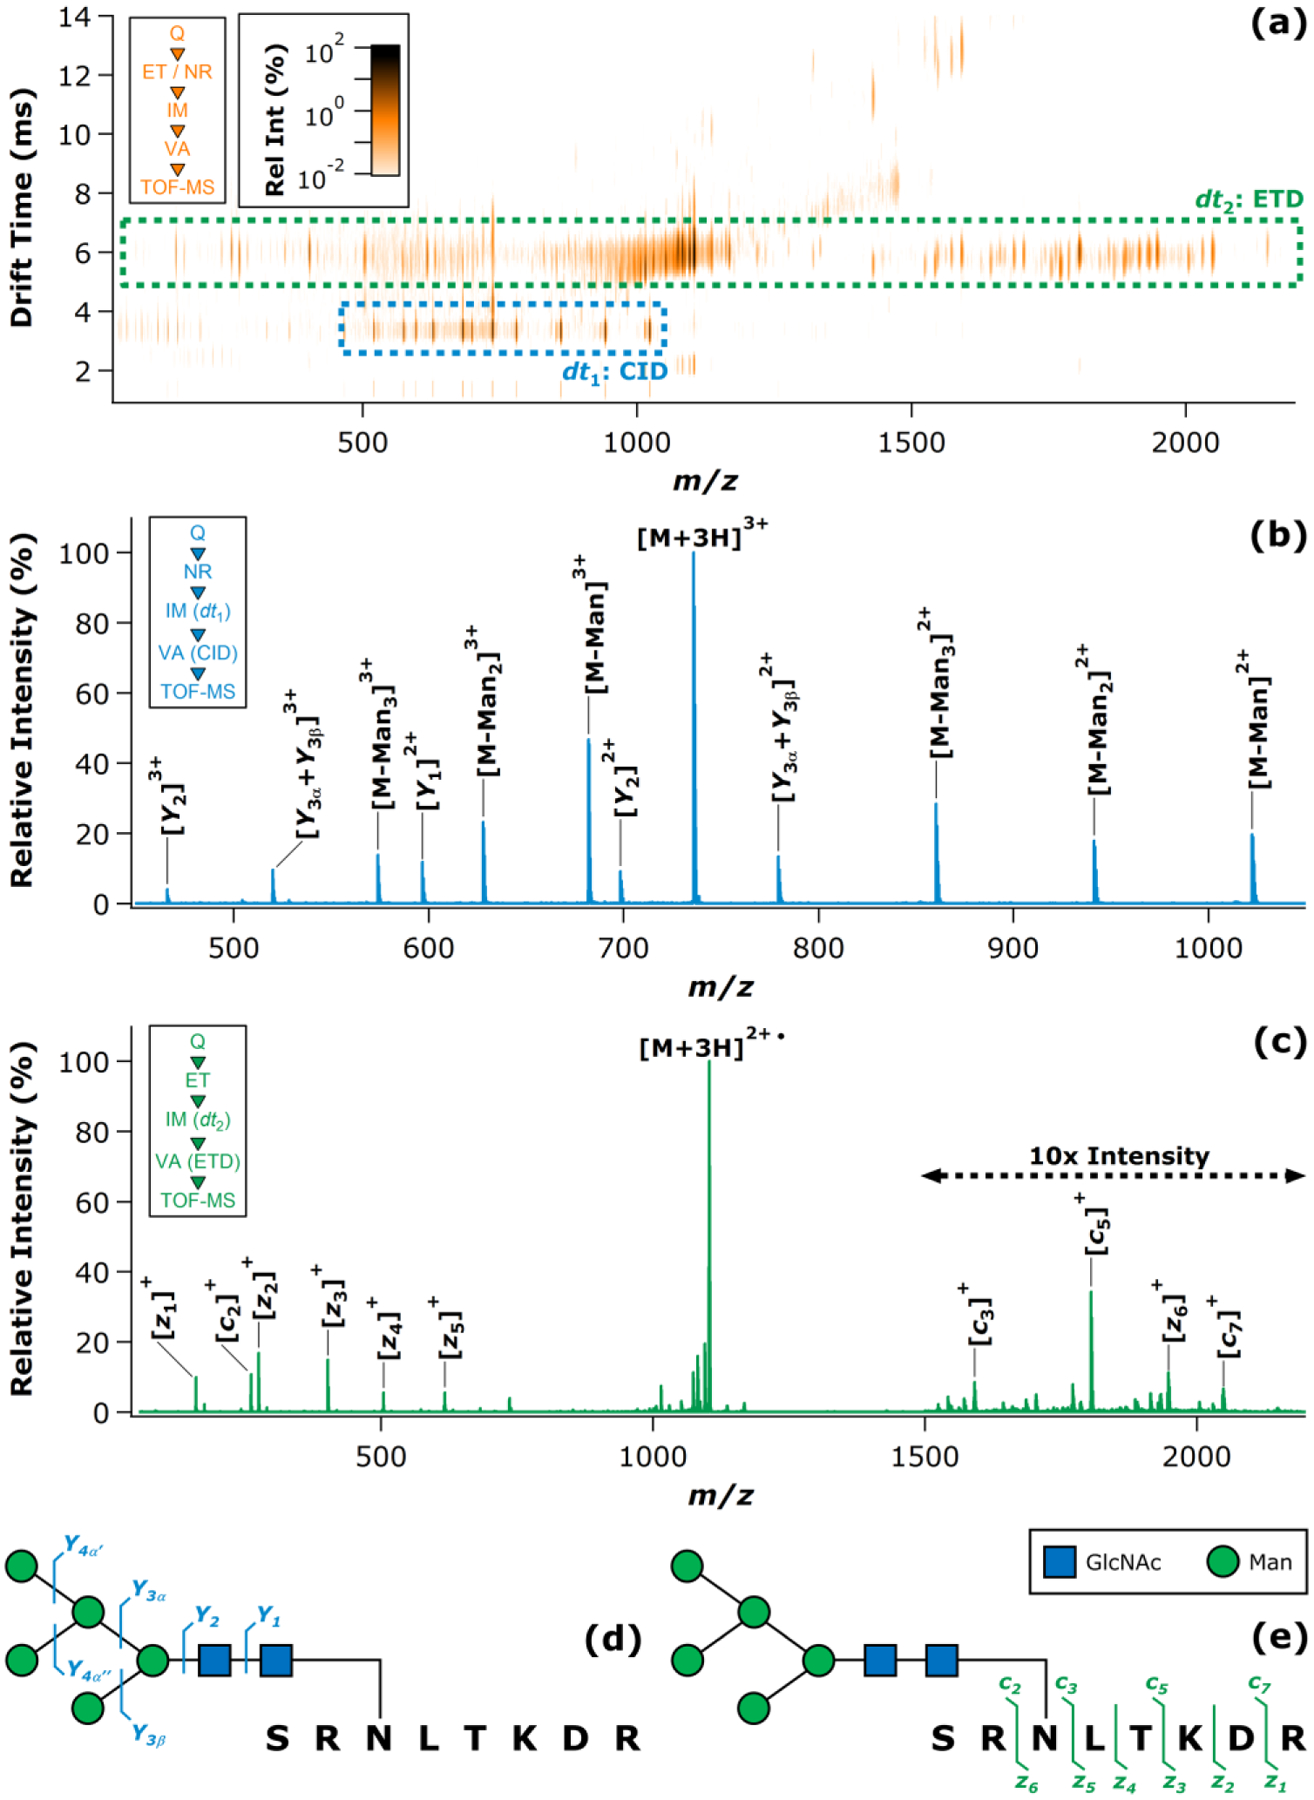
ET-IM-VA analysis of the model N-glycopeptide derived from BRB. The IM-MS heat map is shown in (a), with dashed boxes highlighting the fragment ion populations arising from CID (dt1) and ETD (dt2). The CID spectrum extracted from the boxed dt1 region is given in (b), while the ETD spectrum extracted from the boxed dt2 region is given in (c). Insets in (a) – (c) summarize the experimental sequence corresponding to each plot. Cleavage maps summarizing the observed CID (d) and ETD (e) fragments are also provided, and are accompanied by a key to the monosaccharide symbols (inset).