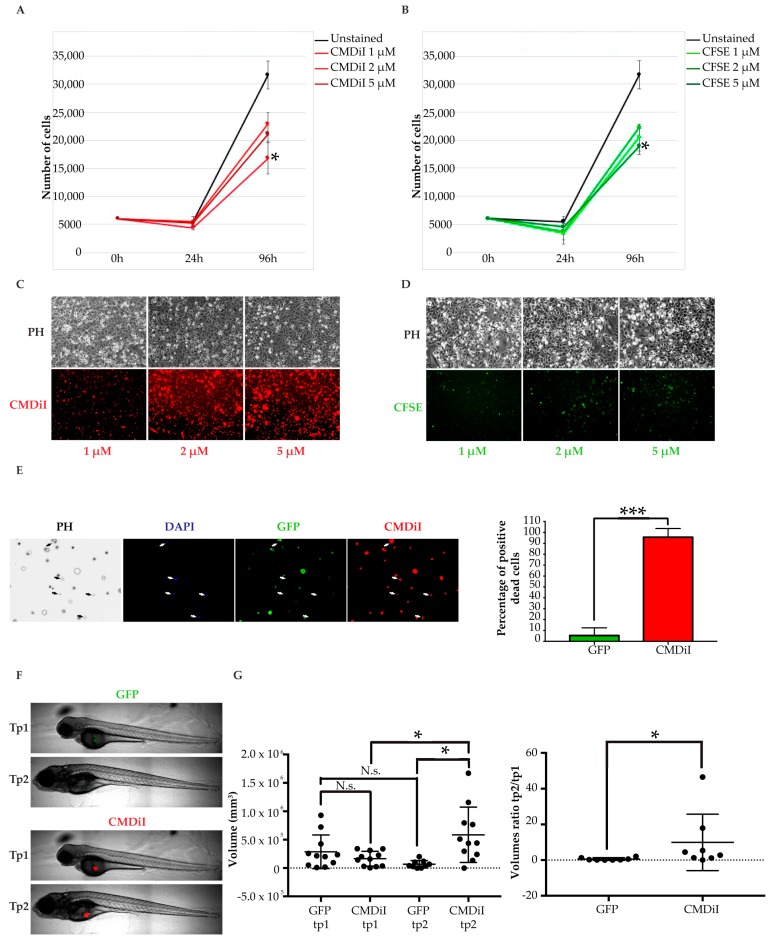
Figure 2.
Fluorescent cell labelling methods coparison. (A,B) analysis of the toxicity of fluorescent dyes. CMDiI (A) and CFSE (B) dyes are toxic at different concentrations in MDA-MB-231 (growth curves). Mean and standard deviation of three counts are represented for every condition at each time point; (C, D) evaluation of cell staining homogeneity of fluorescent dyes. Representative images of cells stained with CMDiI (C) and CFSE (D) at day 4; (E) assessment of fluorescence retention in dead cells. MDA-MB-231 cells stably expressing GFP were stained with CMDiI and exposed to a high dose of DMSO. Dead cells were detected through DAPI staining. They are indicated by white arrows in the representative pictures on the left and quantified in the graph on the right. Six fields of view were analyzed for quantification. Results are represented as mean +/− standard deviation; (F) representative images of GFP+ and CMDiI+ tumors in the same injected fish at the two time points; (G) measurements of tumor volumes corresponding to the same GFP expressing cells and CMDiI labelled cells transplanted in each larva, at tp1 and tp2 (graph on the left). GFP+ and CMDiI+ tumor masses ratios between tp2 and tp1 (graph on the right). Each dot in the graphs represents the measurement of a fish. * indicates p < 0.05, ** means p < 0.01, 3 *** signify p < 0.001, and **** stays for p < 0.0001. No statistical significance is indicated by ns.

