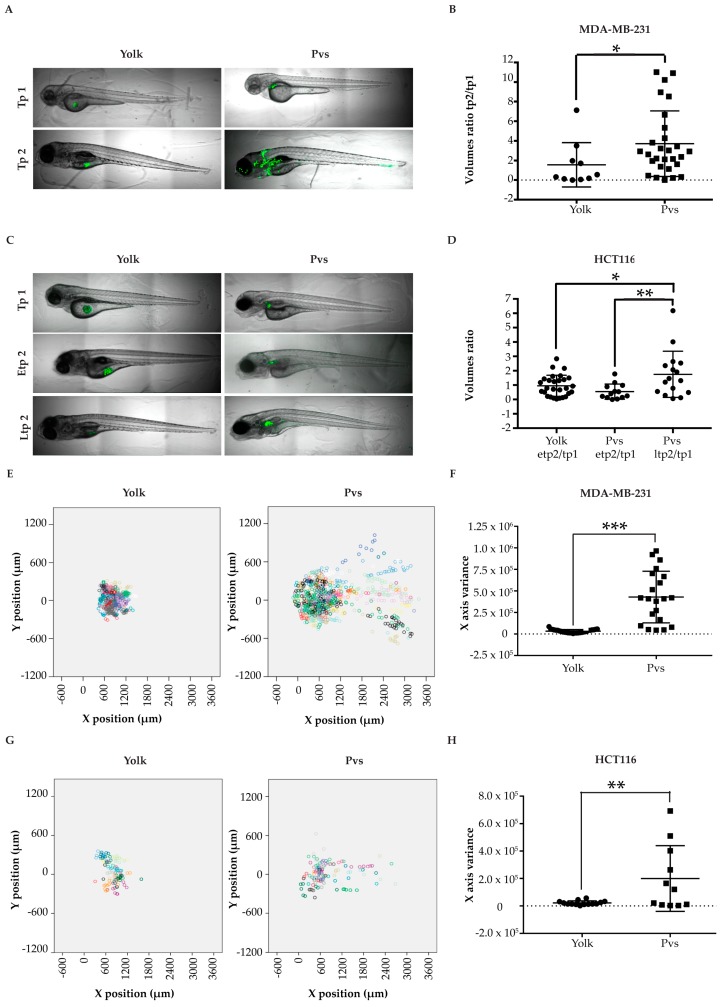
Figure 3.
Injection sites comparison. (A) representative images of larvae injected with MDA-MB-231 cells in the yolk and in the pvs, at two different timepoints; (B) scatter dot plot of the tumor masses ratios between tp2 and tp1, for each larva. Tp1 corresponds to 2 hpi and tp2 to 96 hpi; (C) representative images of larvae injected with HCT116 cells in the yolk and in the pvs, at three different timepoints; (D) scatter dot plot of the volume ratios etp2/tp1 and ltp2/tp1 for each larva. Tp1 corresponds to 24 hpi, etp2 to 96 hpi and ltp2 to 144 hpi. (E,G) Dot plots showing MDA-MB-231 (E) and HCT116 cells (G) dissemination in injected larvae in the yolk and pvs at tp2. Each larva is depicted by a different color. Each dot corresponds to the location of a given segmented tumor mass related to the position of zebrafish eye. (F,H) scatter plots of tumor masses x variance at tp2 in larvae injected in the yolk and in the pvs with MDA-MB-231 (F) and HCT116 (H). Each dot or square in the graphs represents the measurement of a fish. * indicates p < 0.05, ** means p < 0.01, 3 *** signify p < 0.001, and **** stays for p < 0.0001. No statistical significance is indicated by ns.

