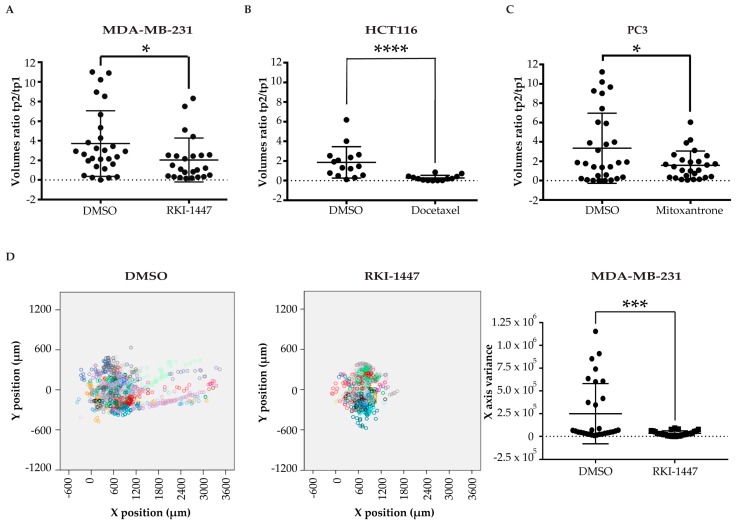
Figure 4.
Pharmacological validation (A–C) scatter plots of the ratios between the tumor volumes at tp2 and tp1 of MDA-MB-231 (A), HCT116 (B), and PC3 (C) injected cells treated with RKI-1447, docetaxel, and mitoxantrone, respectively, vs. DMSO control. Tp1 refers to 2 hpi for MDA-MB-231 and 24 hpi for HCT116 and PC3. Tp2 corresponds to 96 hpi for MDA-MB-231 and PC3 and 144 hpi for HCT116; (D) combined scatter plots, on the left, and scatter dot plot, on the right, of the variance in the x-axis at tp2 of secondary tumor foci in MDA-MB-231 injected larvae, treated with control DMSO and RKI-1447. Each dot or square in the graphs represents the measurement of a fish. * indicates p < 0.05, ** means p < 0.01, 3 *** signify p < 0.001, and **** stays for p < 0.0001. No statistical significance is indicated by ns.

