Figure 5.
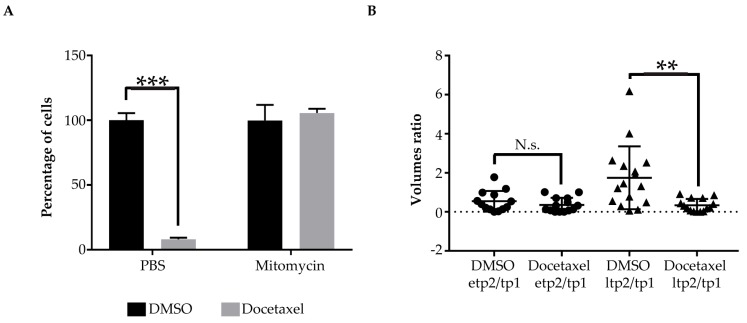
Addressing drugs MoA (A) bar graphs showing percentages of HCT116 cells surviving after incubation with mitomycin C or PBS control and subsequent treatment with docetaxel or DMSO control. Three cell counts were performed per condition. Results are represented as mean +/− standard deviation; (B) scatter dot plot of the tumor volume ratios between etp2 and tp1 and ltp2 and tp1 of HCT116 xenografts treated with Docetaxel or DMSO control. Tp1 corresponds to 24 hpi, etp2 to 96 hpi and ltp2 to 144 hpi. Each dot or triangle in the graphs represents the measurement of a fish. * indicates p < 0.05, ** means p < 0.01, 3 *** signify p < 0.001, and **** stays for p < 0.0001. No statistical significance is indicated by ns.

