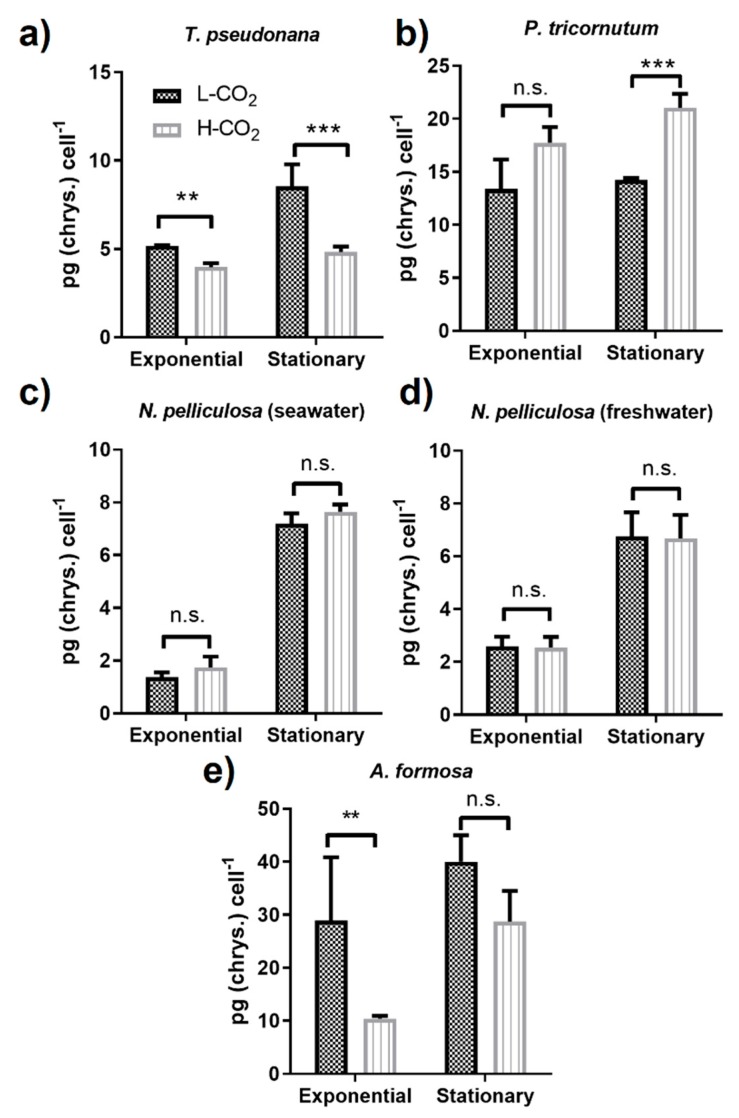
Figure 3.
Production of chrysolaminarin in diatoms (a–e) at different CO2 concentrations. All panels represent low CO2 (L-CO2; 400 ppm, dark grey bars) and high CO2 (H-CO2; 20,000 ppm, light grey and dashed bars) as in panel (a). Average and error bars (SD) are represented (n = 3). ** p ≤ 0.01, *** p ≤ 0.005, and ns, not significant.

