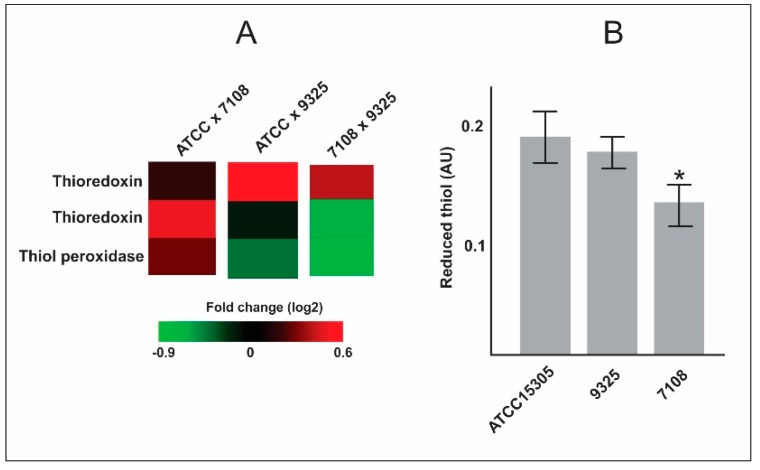
Figure 1.
Thioredoxins and thiol peroxidases expression and enzymatic assay. (A) Heat map of protein abundance. Heat map showing fold change (log2) comparing proteomic data of thioredoxins and thiol peroxidase abundance among S. saprophyticus strains. (B) Enzymatic assay of thiol reduction. The reactions were performed using protein extracts from the three S. saprophyticus strains. Reduced thiol formed was measured. The assay was performed in biological duplicate and experimental triplicate. Asterisk indicates statistical significance (p < 0.05) when compared to any of the other strains using Student’s t test.

