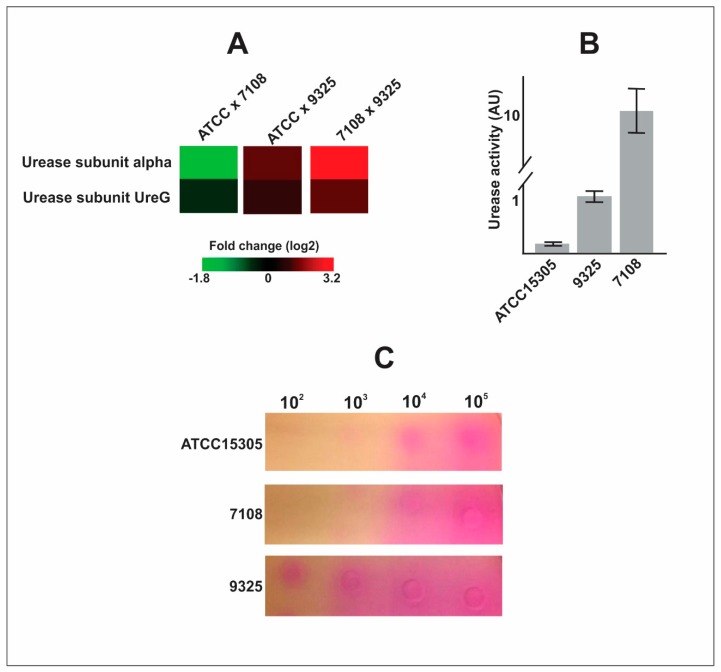
Figure 2.
Urease enzymatic assays with protein extract from and secreted by S. saprophyticus cells. (A) Heat map of urease subunits expression. Heat map showing fold change (log2) comparing proteomic data of urease subunits abundance among S. saprophyticus strains. (B) Urease activity. The enzymatic assay is shown in arbitrary units (AU) performed with protein extracts of S. saprophyticus strains. The experiment was performed using three biological replicates and with three technical triplicates. (C) Evaluation of secreted urease activity. The S. saprophyticus cells were serially diluted from 105 to 102 cells and inoculated in urease agar plates. The urease activity is detected by change of color of the medium, from yellow to purple. The experiment was performed with biological triplicates and representative images are shown.

