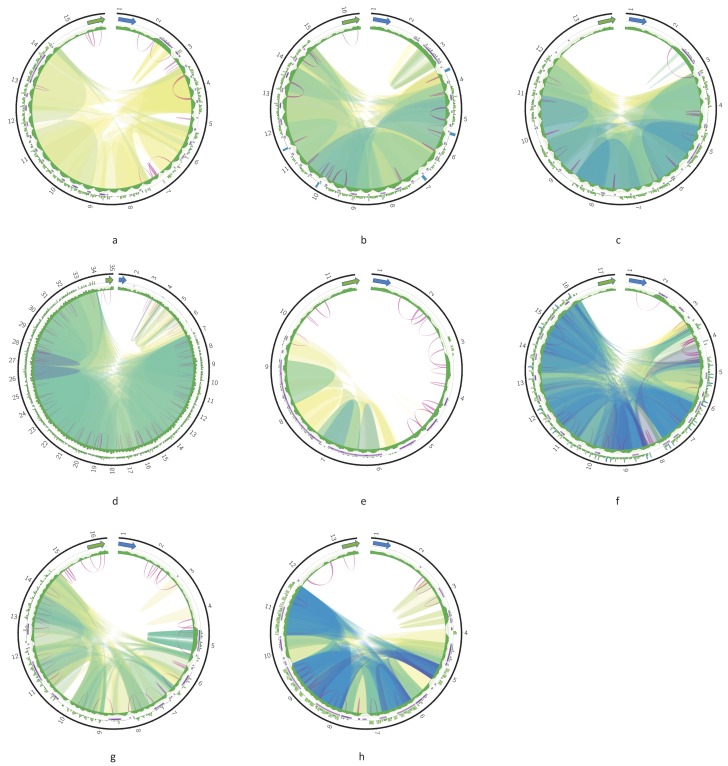
Figure A2.
Circos plots of the DR of Leishmania aethiopica (a); Leishmania tropica (b); Leishmania mexicana (c); Trypanosoma cruzi strain Dm28c (d); Crithidia expoeki (e); Herpetomonas megaseliae (f); Leishmania braziliensis strain 208-954 (g); Leishmania braziliensis strain 208-905 (h). Green and blue arrows indicate 12S and ND5 genes, respectively. The outer track is a histogram of 24-mer frequency; the middle track shows tandem repeats; the inner track is a GC content profile. Ribbons inside the circle connect homologous regions; the color represents percent of sequence identity in the range [80%; 100%]. Violet arcs denote inverted repeats.

