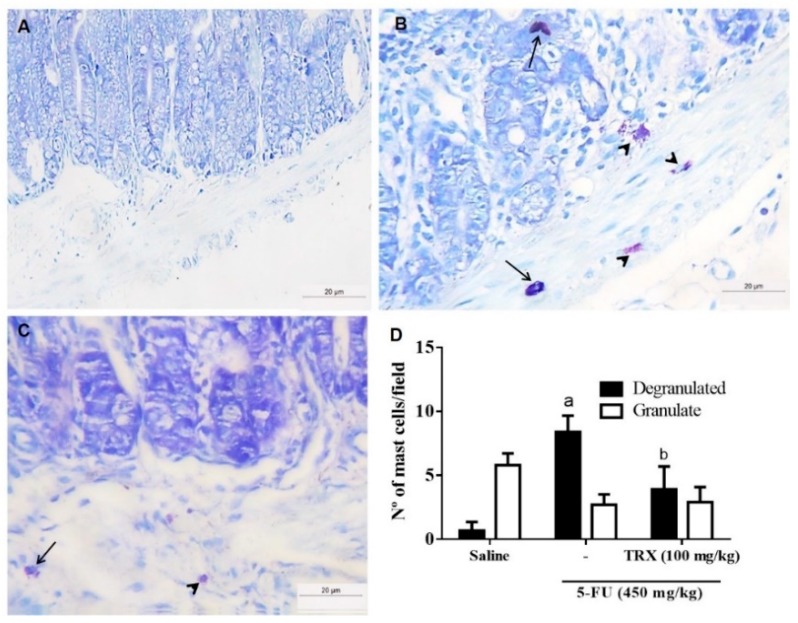
Figure 5.
Mast cell counts in the duodenal segments based on toluidine blue staining. Panels (A), (B), and (C) correspond to Saline, 5-FU, and TRX-100 groups, respectively. (D): Statistical representation of experimental groups. Degranulated mast cells (arrow) and granulated mast cells (arrowhead). All the panels were obtained at ×400 magnification. Values are presented as mean ± SEM of the number of mast cells per field. For the statistical analysis, one-way ANOVA followed by Tukey’s test was used. a: p < 0.05 in 5-FU vs. Saline group; b: p < 0.05 in TRX-100 vs. 5-FU group.

