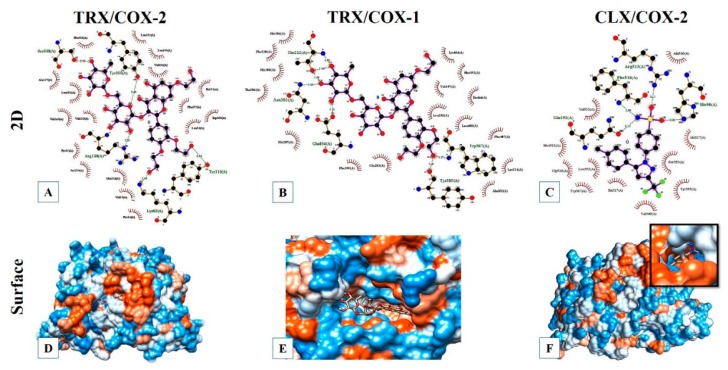
Figure 9.
Molecular docking models of TRX or CLX with COX-1 and COX-2. (A), (B), and (C): Ligplot 2D diagrams showing details of hydrogen bond and hydrophobic interactions in complexes TRX/COX-2, TRX/COX-1, and CLX/COX-2, respectively. (D), (E), and (F): Surface docking poses of TRX/COX-2, TRX/COX-1, and CLX/COX-2, respectively.

