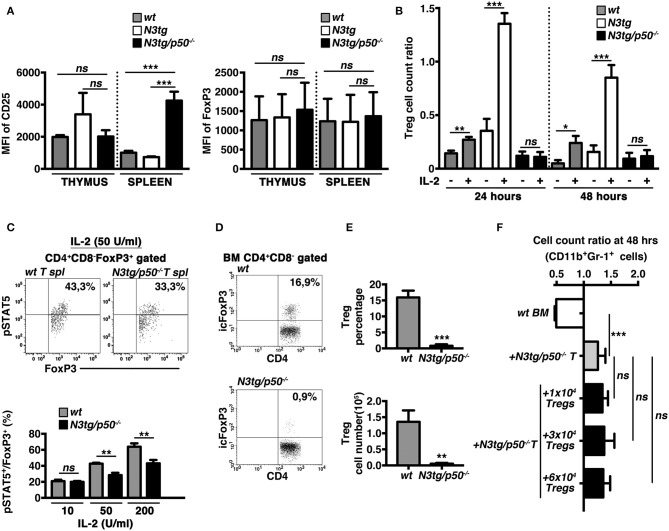
Figure 11.
The IL-2/STAT5 signaling is affected in Tregs from N3tg/p50−/− mice. (A) The histograms represent the MFI of CD25 (left panel) and Foxp3 (right panel) in gated CD4+CD8−FoxP3+ subsets from thymus and spleen of wt, N3tg, and N3tg/p50−/− mice at 4–5 weeks of age. (B) The graph represents the ratio of the Treg cell count at 24 or 48 h and the related Treg cell count at 0 h in culture samples of T splenocytes from N3tg/p50−/−, N3tg, or wt mice at 4–5 weeks of age, in the absence (–) or presence (+) of anti-CD3/IL-2 stimulation. In (A,B) the values are presented as mean ± SD of three independent experiments (n = 3 mice per group). ns, not significant; *P ≤ 0.05, **P ≤ 0.01, and ***P ≤ 0.001 represent significant differences between the indicated groups. (C) In the upper panels, representative FACS analysis of pSTAT5 expression inside CD4+CD8−FoxP3+ subset of total T splenocytes (T spl) from N3tg/p50−/− and wt mice at 4–5 weeks of age, upon activation with 50 U/ml of rhIL-2. Numbers inside each cytogram represent the percentages of pSTAT5+FoxP3+cells inside gated CD4+CD8−FoxP3+ subset. In the lower panel the graph represents the percentages of pSTAT5+FoxP3+cells inside CD4+CD8−FoxP3+ compartment of total T splenocytes from wt and N3tg/p50−/− mice at 4–5 weeks of age, following the activation with rhIL-2, at the indicated doses. Samples stained without rhIL-2 stimulation served as negative control (not shown). The values are presented as mean ± SD of three independent experiments (n = 3 mice per group), in triplicates. ns, not significant; **P ≤ 0.01 represents significant differences between the indicated groups. (D) Representative dot plots of icFoxP3/CD4 distributions inside gated CD4+CD8− T cells from BM of N3tg/p50−/− vs. wt mice at 4–5 weeks of age, as assessed by FACS analysis. Percentages of FoxP3+CD4+ cells are indicated inside each cytogram. (E) Mean percentage values (upper panel) and absolute numbers (lower panel), of Foxp3+ Tregs inside the CD4+CD8−subset in the BM from N3tg/p50−/− and wt mice, assessed as in (D). The values are presented as mean ± SD of three independent experiments (n = 3 mice per group). **P ≤ 0.01, ***P ≤ 0.001 represent significant differences between the N3tg/p50−/− samples and the relative wt controls. (F) The graph represents the ratio of the CD11b+Gr1+ cell count at 48 h to the related CD11b+Gr1+ cell count at 0 h in wt BM cells cultured alone (wt BM), as a basal control, in the co-cultures of wt BM cells with T splenocytes from N3tg/p50−/− mice (+N3tg/p50−/− T), as well as in the co-cultures of wt BM cells with T splenocytes from N3tg/p50−/− mice in the presence of different numbers of CD4+CD8−EGFP+ Tregs purified from the spleen of the Foxp3EGFP “knock-in” reporter mice (+N3tg/p50−/−T + 1 × 10⁴/3 × 104/6 × 104 Tregs). Data represent the mean ± SD of three independent experiments (n = 3 mice per group), each in triplicates. ns, not significant; ***P ≤ 0.001 represents significant differences between the indicated groups.

