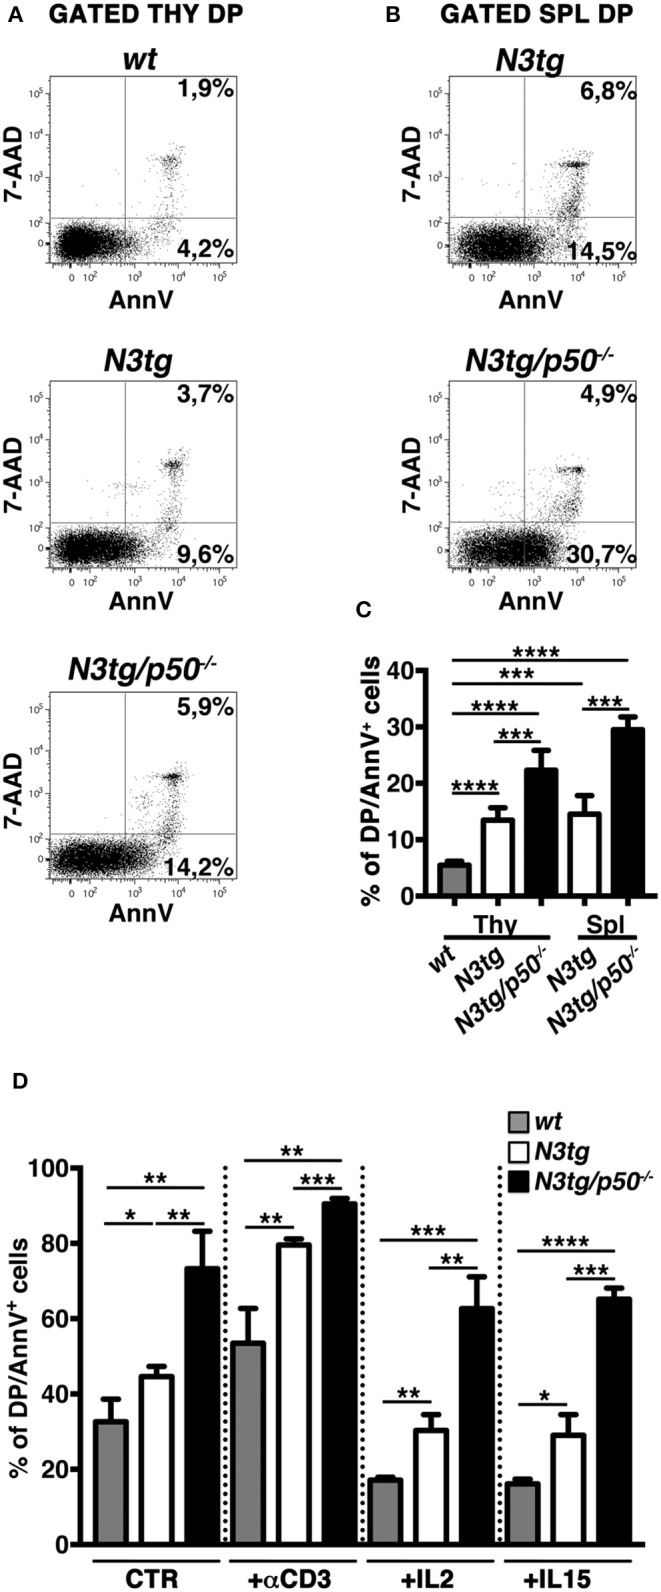
Figure 9.

Increased apoptotic rate of CD4+CD8+ (DP) T cells from N3tg/p50−/− mice. Representative dot plots of 7AAD/Annexin V distributions inside gated CD4+CD8+ (DP) T cells from thymus (A) and spleen (B) of N3tg/p50−/− vs. N3tg mice at 4–5 weeks of age. DP thymocytes from wt littermates were used as a control. Percentages of both 7 AAD−Annexin V+ early apoptotic cells and 7AAD+Annexin V+ late apoptotic cells are indicated inside each cytogram. (C) The graph illustrates the percentages of Annexin V+ cells inside DP T compartment from thymus (Thy) and spleen (Spl) of N3tg/p50−/− and N3tg mice at 4–5 weeks of age, as well as from thymus of wt controls. The values are presented as mean ± SD of four independent experiments (n ≥ 4 mice per group). ***P ≤ 0.001 and ****P ≤ 0.0001 represent significant differences between the indicated groups. (D) The graph reports the percentages of DP/Annexin V+ cells, assessed by flow cytometry, in thymocytes from N3tg/p50−/−, N3tg, and wt mice cultured for 48 h in the following conditions: untreated (CTR), upon TCR activation with anti-CD3 stimulation (+αCD3), or in the presence of survival cytokines such as IL-2 (+IL2) or IL-15 (+IL15). The values are presented as mean ± SD of three independent experiments (n = 3 mice per group), in triplicates. ns, not significant; *P ≤ 0.05, **P ≤ 0.01, ***P ≤ 0.001, and ****P ≤ 0.0001 represent significant differences between the indicated groups.
