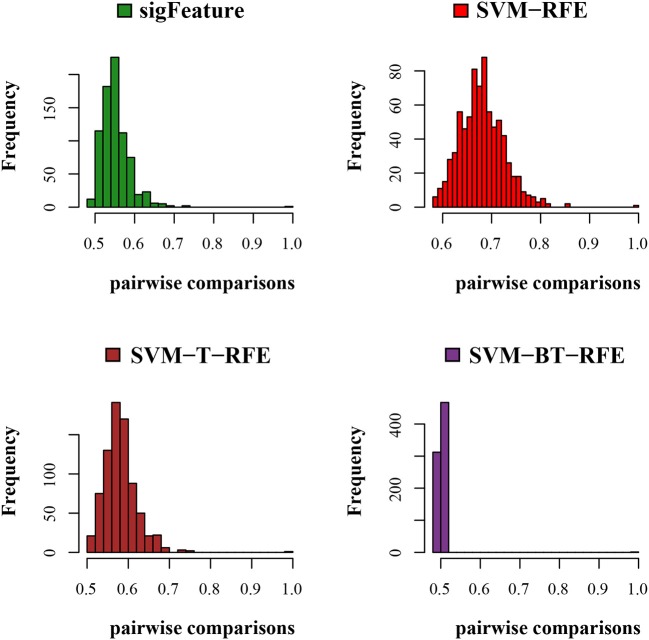
Figure 3.
Histogram plots for pairwise stability comparison of the features. Distribution plots of the pairwise stabilities for the data set GSE2280 where different algorithms produce the feature lists. In each iteration of the algorithms, we used 40 bootstraps, eliminated E = 1% features, used a signature size of 10%, and selected the CLA aggregation model.

