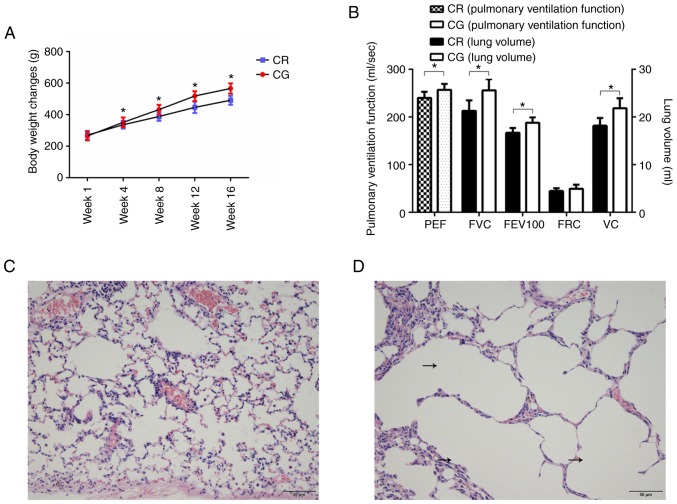
Figure 2.
Bodyweight and pulmonary function and structure following model establishment. (A) Weight change during model establishment. (B) Comparison of pulmonary function between model rats and CG. (C) Pulmonary structure in CG. Scale bar=50 µm. (D) Pulmonary structure in model rats. Scale bar=50 µm. The black arrows indicate the enlarged alveoli. *P<0.05. PEF, peak expiratory flow; FVC, forced vital capacity; FEV100, 100 milliseconds forced expiratory volume; FRC, functional residual capacity; VC, vital capacity; peak expiratory flow; CR, chronic obstructive pulmonary disease rats; CG, control group.

