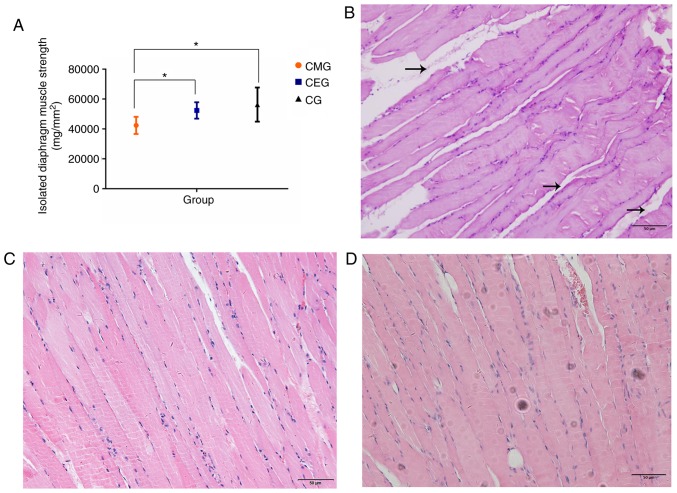
Figure 4.
Changes in diaphragm muscle strength and histology after the intervention. (A) Diaphragm strength among three different groups following intervention. (B) Histological observations of the diaphragm tissues in the CMG. The black arrows indicate the enlarged muscle fiber gaps. Scale bar=50 µm. (C) Histological observations of the diaphragm tissues in the CEG. Scale bar=50 µm. (D) Histological observations of the diaphragm tissues in the CG. Scale bar=50 µm. *P<0.05. COPD, chronic obstructive pulmonary disease; CMG, COPD model group; CEG, COPD + exercise group; CG, control group.

