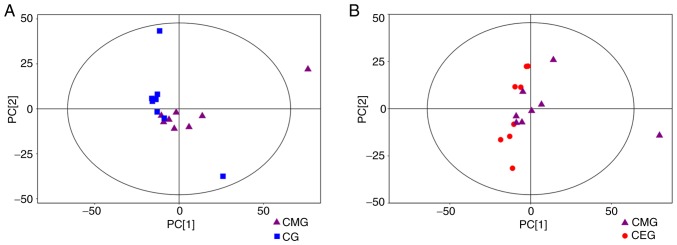
Figure 5.
Score scatter plot of the PCA model. (A) Score scatter plot of the PCA model for CG vs. CMG. (B) Score scatter plot of the PCA model for CMG vs. CEG. Most samples in the score plots were within the 95% Hotelling's T-squared ellipse. PCA, principal component analysis; COPD, chronic obstructive pulmonary disease; CMG, COPD model group; CEG, COPD + exercise group; CG, control group.

