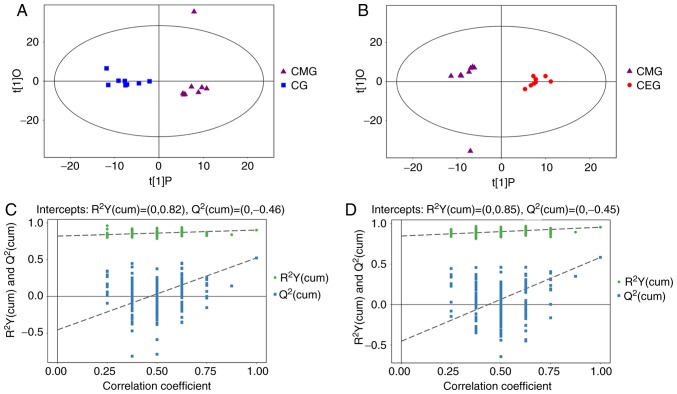
Figure 6.
Results of OPLS-DA. (A) Score scatter plot of the OPLS-DA model for CG vs. CMG. (B) Score scatter plot of the OPLS-DA model for CMG vs. CEG. (C) Permutation test of the OPLS-DA model for CG vs. CMG. (D) Permutation test of the OPLS-DA model for CMG vs. CEG. CMG, COPD model group; CEG, COPD plus exercise group; CG, control group; OPLS-DA, orthogonal projections to latent structures-discriminant analysis; COPD, chronic obstructive pulmonary disease; CMG, COPD model group; CEG, COPD + exercise group; CG, control group.

