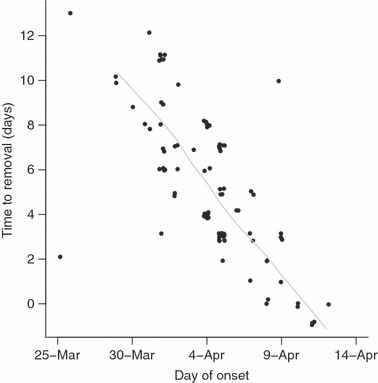
Figure 3.

Delay from onset of symptoms to removal (discharge or transfer to isolation facility at another hospital) from hospital B. Times are recorded only to the nearest day, but a small amount of random noise (jitter) has been added to the points to enable visualization of overlapping data points. A lowess (locally weighted regression) smoothing line is also plotted.
