
Figure 2.
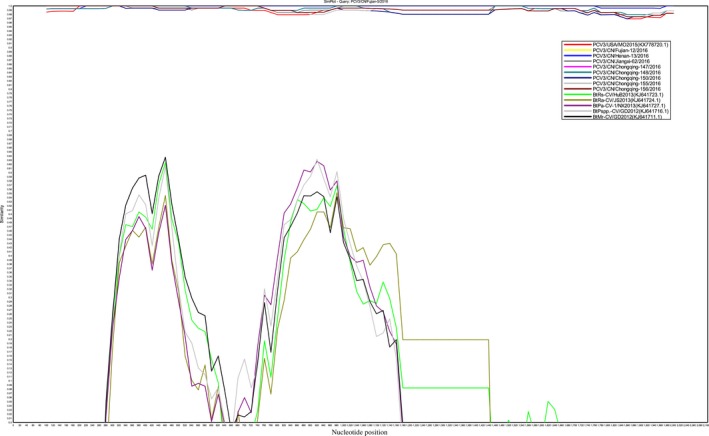
Similarity plot of the whole genome of 10 PCV3 isolates with 5 Bat circovirus isolates. The Chinese PCV3 isolates, PCV3/CN/Fujian‐5/2016, was set as query strain. The similarity plot was constructed using the two‐parameter (Kimura) distance model with a sliding window of 200 bp and step size of 20 bp. The vertical and horizontal axes indicate the nucleotide similarity per cent and nucleotide position (bp) in the graph, respectively.