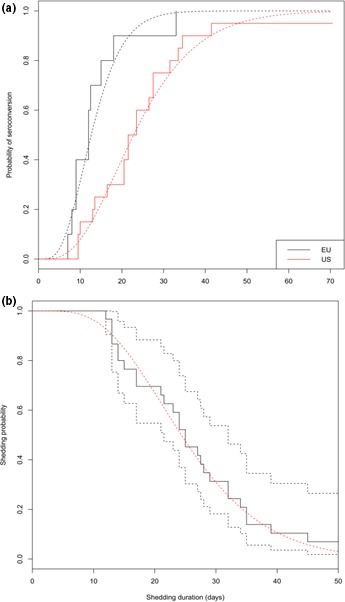
Figure 3.

Delays between infection and seroconversion (a) and the probability of shedding (b) for the InDel strain indicated in black and the non‐InDel strain indicated in red. In (a), the solid lines represent the raw data and the dotted lines represent the probability of seroconversion after shedding. In (b), the black solid line represents the raw data, the black dotted lines represent the confidence interval, and the red dotted line represents the probability of shedding [Colour figure can be viewed at http://wileyonlinelibrary.com]
