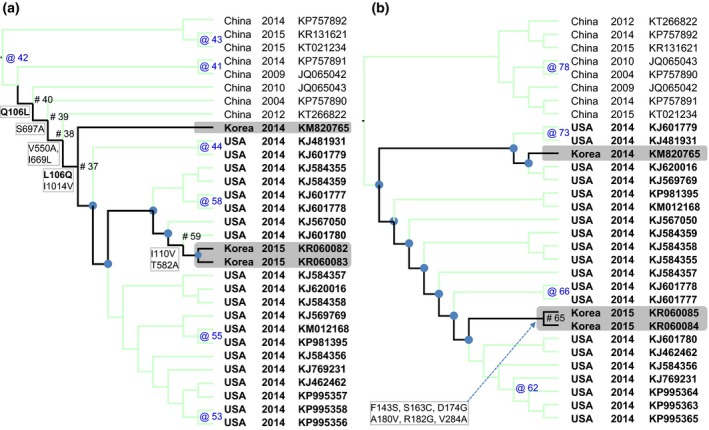
Figure 2.

The maximum likelihood trees based on the S gene (a) and the N gene (b) with reconstructed non‐synonymous substitutions were mapped to the nodes of the phylogeny. For clarity, only branches leading to Korean PDCoV isolates were highlighted (black lines). The nodes where non‐synonymous substitutions occurred were indicated by # (for the highlighted branches) and by @ (for the others). The nodes without non‐synonymous substitutions were marked by ● (for the highlighted branches) and were not marked (for the others). It was observed that the branch which leaded to 2015 isolates (SL2, SL5) accumulated further mutations in comparing to the branch which leaded to 2014 isolate (KNU14.04).
