Figure 1.

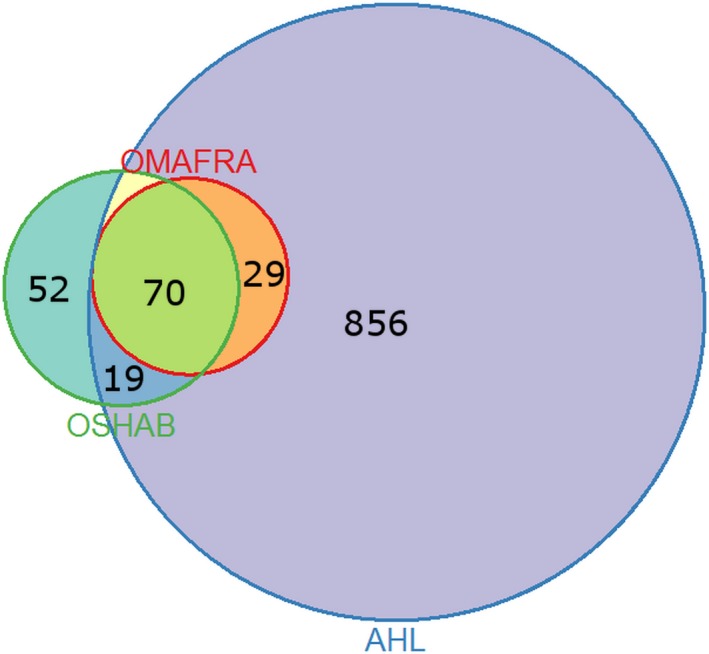
Venn diagram representing overlap among the three surveillance components for identification of new cases of the porcine epidemic diarrhoea virus (PEDV) in Ontario (Canada) between 2014 and 2016—The Animal Health Laboratory (AHL), Ontario Ministry of Agriculture Food and Rural Affairs (OMAFRA) and the Ontario Swine Health Advisory Board (OSHAB). The size of individual circles should be proportional to the number of positive cases recorded by a specific surveillance component. The overlapping areas should represent cases that were identified by as many surveillance components as are being overlapped. The numbers listed in a specific area represent number of cases that are identified by a specific surveillance component or combination thereof
