
Figure 2.
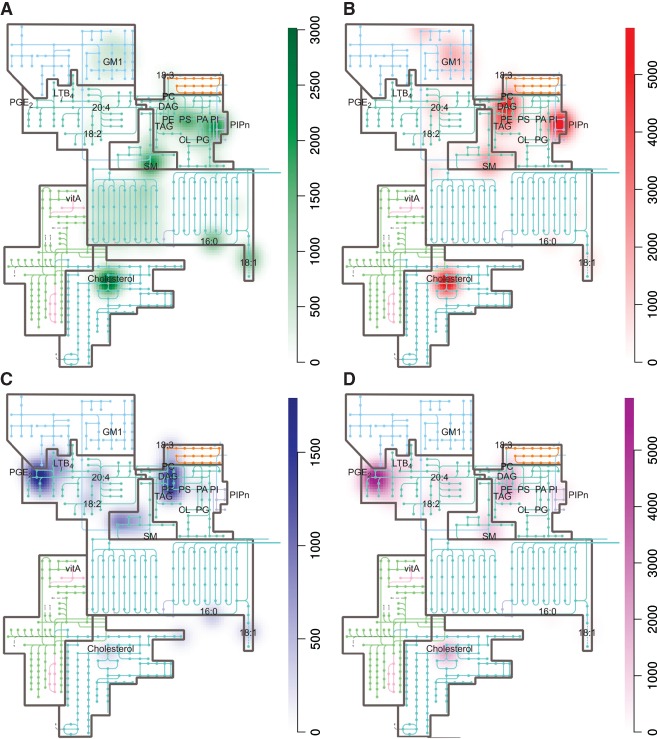
The involvement of lipids in host–pathogen interactions. Heat maps were generated for different types of pathogens (panels A–D) based on the weighted involvements of lipids in host–pathogen interactions (the list of pathogens and their lipid targets and weight factor is described in Table S1, Supporting Information). Heat maps show the frequency of involvements of specific host cell lipid (sub)classes (e.g. phosphatidylserine) and/or species (e.g. cholesterol) for viruses (A), bacteria (B), fungi (C), and parasites (D). Increased coloring indicates increased frequency. The heat maps were constructed with an algorithm using the R‐package for spatial statistics (spatstat) 247.