
Figure 2.
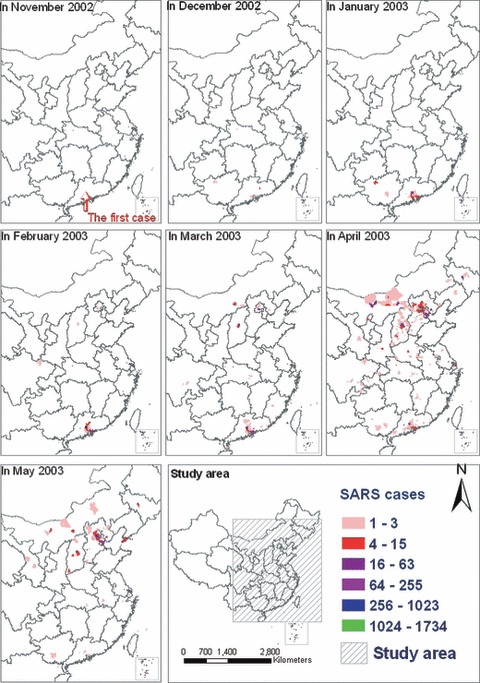
The monthly spatial distribution map of SARS incidence in mainland China. See Figure 1 for further explanation.
Official websites use .gov
A
.gov website belongs to an official
government organization in the United States.
Secure .gov websites use HTTPS
A lock (
) or https:// means you've safely
connected to the .gov website. Share sensitive
information only on official, secure websites.
The monthly spatial distribution map of SARS incidence in mainland China. See Figure 1 for further explanation.