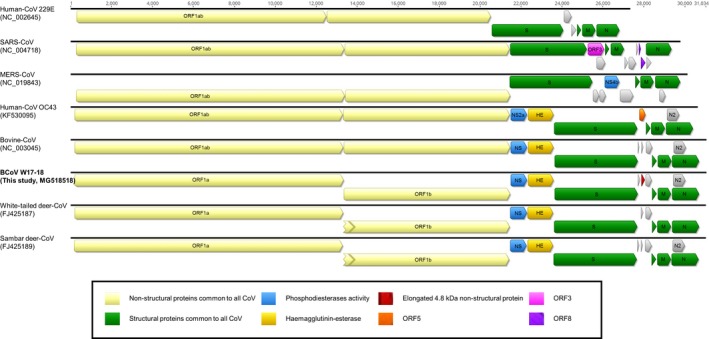
Figure 2.

Comparison of CoV genomes. The genome organization is schematically reported, grouping the viruses according to their genus or lineage. Grey‐coloured boxes represent accessory open reading frames (ORFs) of the CoV genomes [Colour figure can be viewed at http://wileyonlinelibrary.com]
