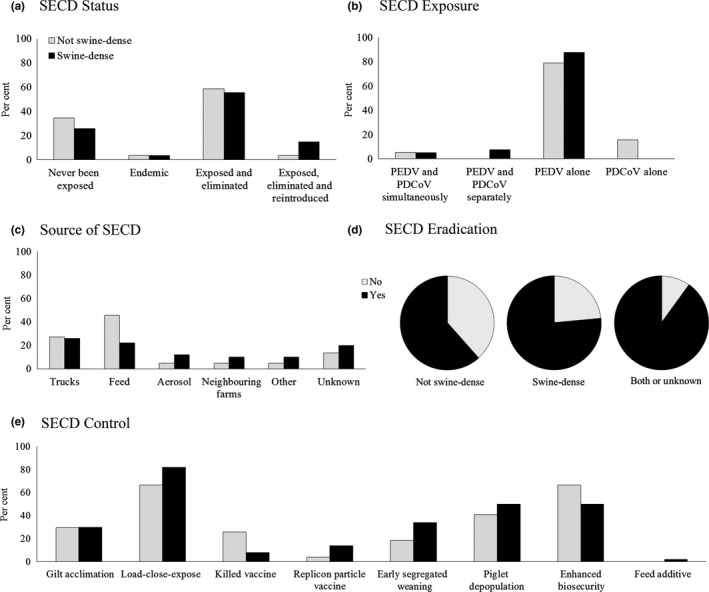
Figure 5.

Swine enteric coronavirus survey responses comparing swine‐dense and not swine‐dense herds. Data are shown as the per cent of herds considered swine‐dense (black bars) and not swine‐dense (grey bars) with each response in regard to status (a), exposure (b), source (c) and methods for control (e). In (d), data are shown as the proportion of each group with yes or no responses to the possibility of eradicating porcine epidemic diarrhoea virus (PEDV) and PDCoV. The category of both or unknown represents individuals who included information for both swine‐dense and not‐swine‐dense herds or only answered this opinion question
