
Figure 2.
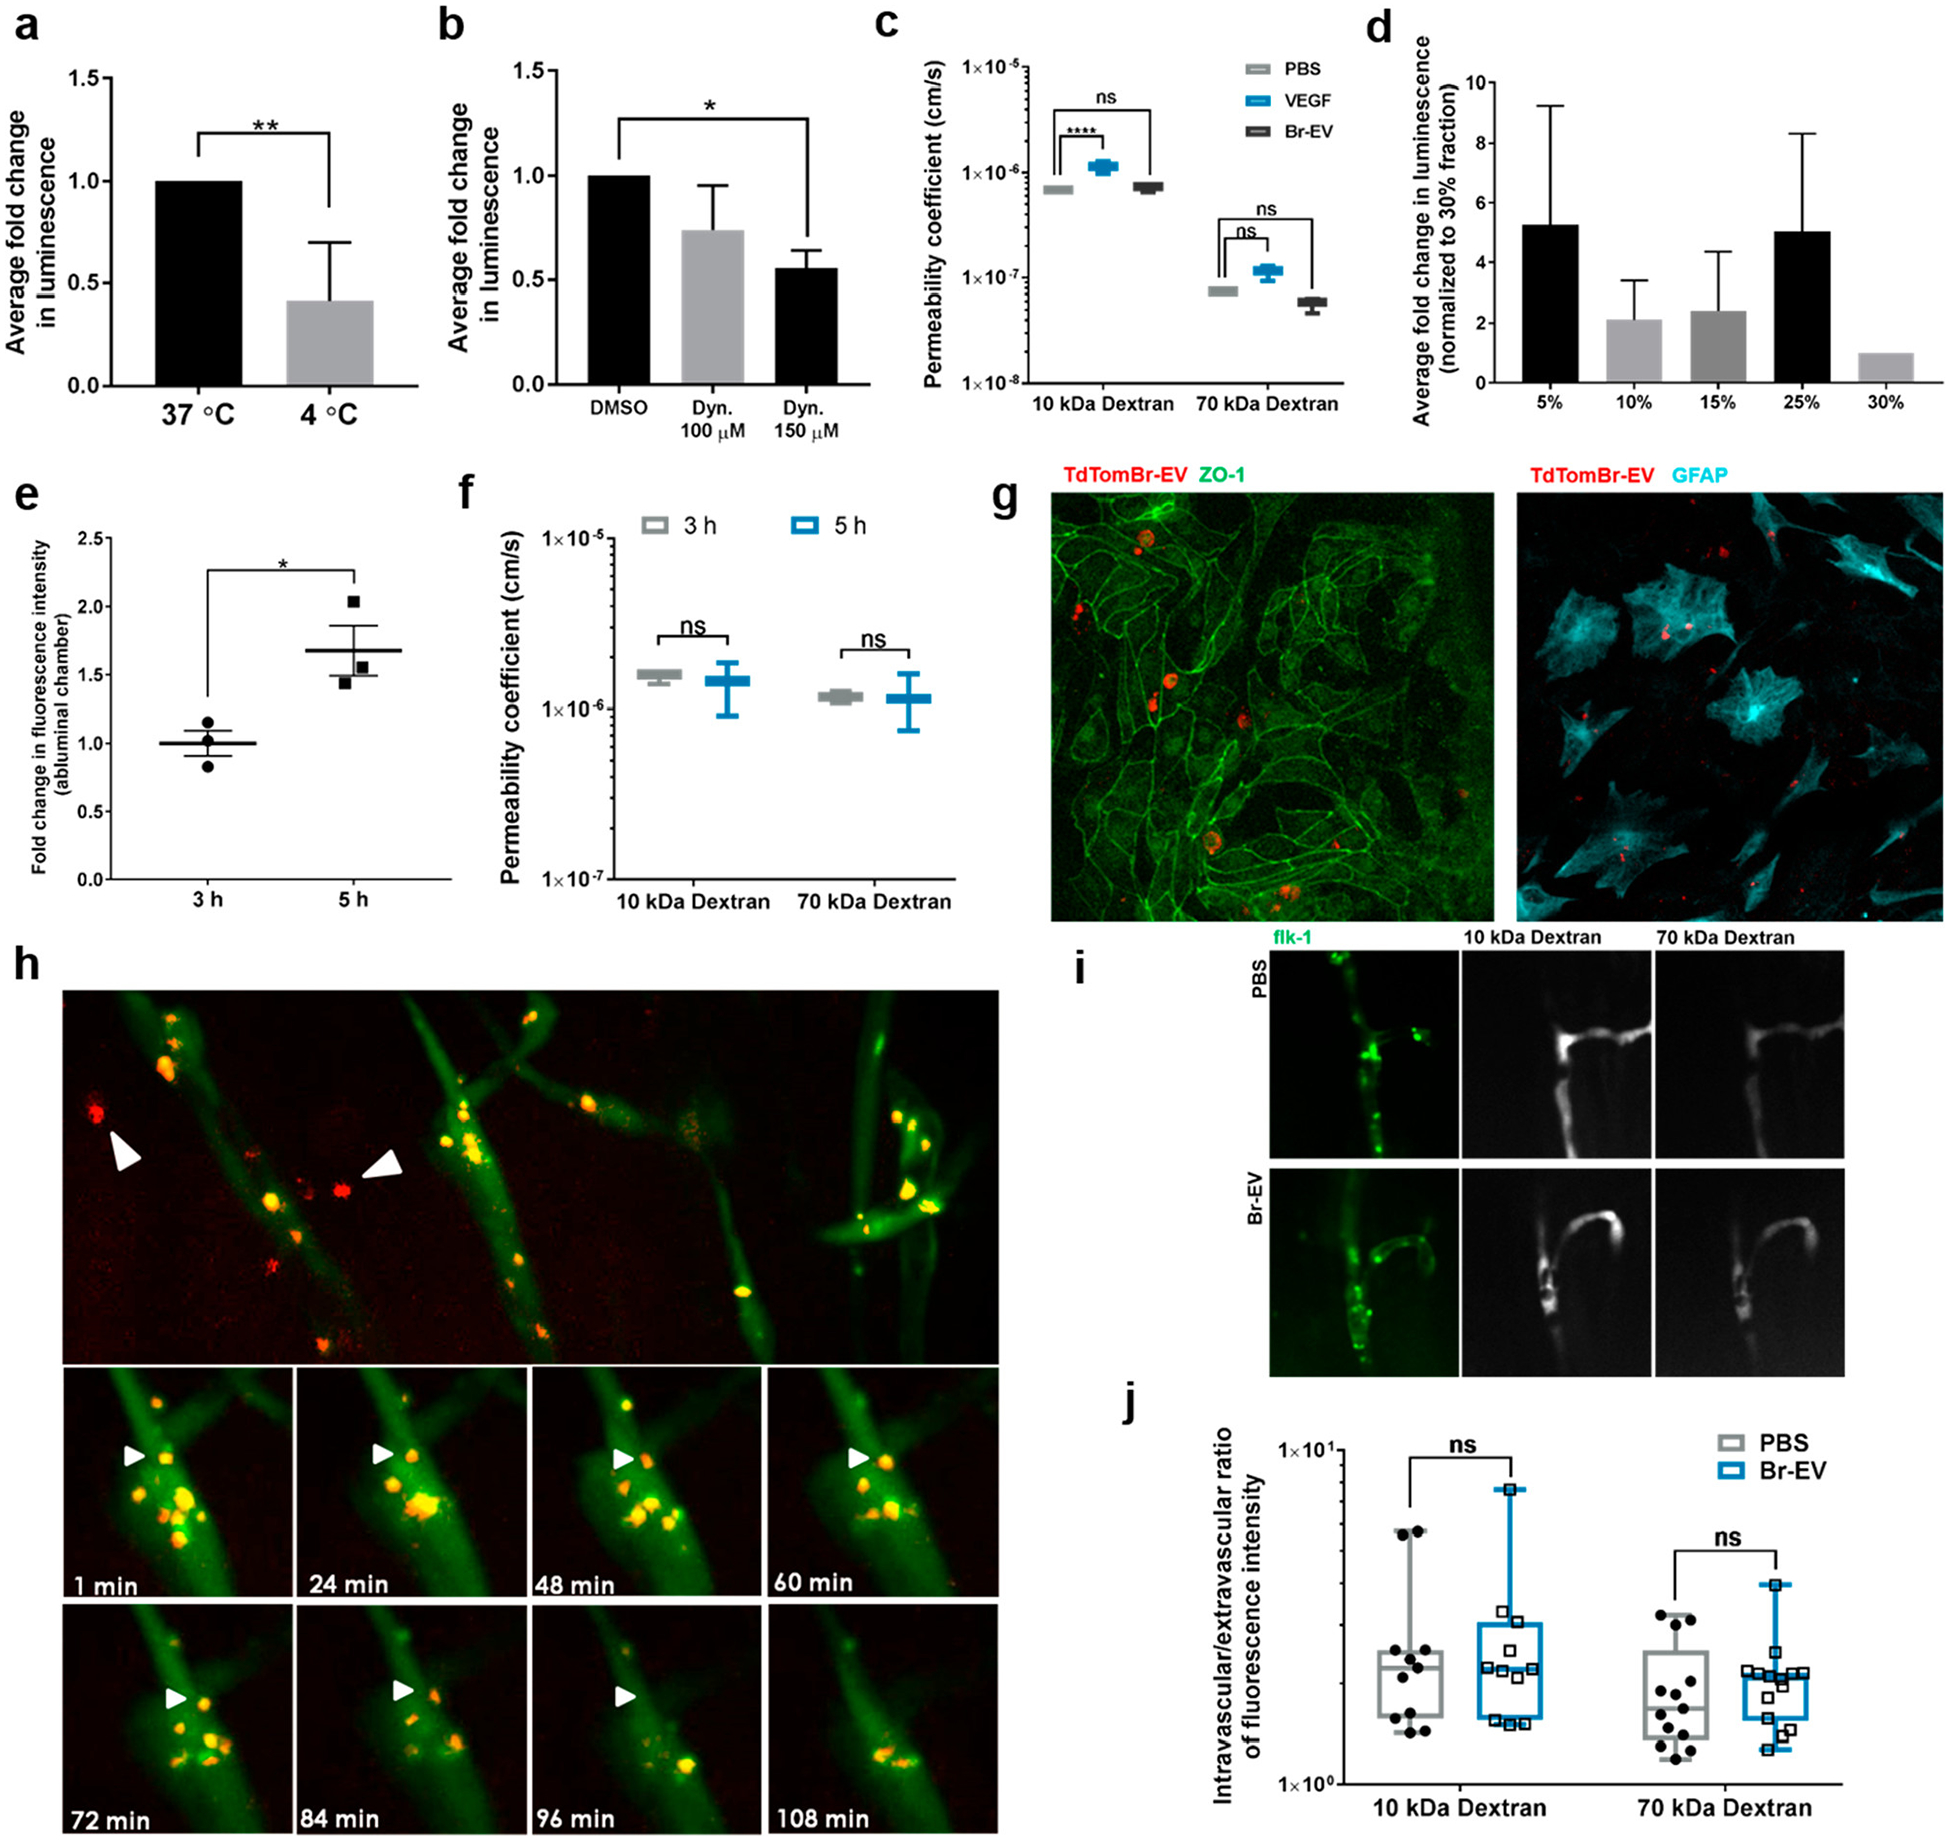
Br-EVs cross the brain endothelium via transcytosis. (a) Fold change in luminescent signal in the media from abluminal chamber of a Transwell BBB model under the effect of temperature and (b) endocytosis inhibition (mean ± SD; 3 independent experiments). Statistical analyses were performed using (a) unpaired two-tailed Student’s t test and (b) one-way ANOVA with Tukey’s multiple comparison test. (c) Effect of Br-EVs and VEGF (positive control) on the permeability coefficient of the endothelial monolayer to 10 and 70 kDa dextran (mean ± SD; 3 independent experiments). Statistical analysis was performed using two-way ANOVA with Sidak’s multiple comparison tests. (d) Fold change in luminescence intensity of the density gradient fractions of the media from the abluminal chamber. Luminescent signal was normalized to that of the 30% fraction, which does not contain EVs. The 15% and 25% fractions correspond to EV density of 1.105–1.184 g/mL (mean ± SD; 3 independent experiments). (e) Time-dependent increase in fluorescent signal in the abluminal channel of an in vitro BBB chip (mean ± SD; 3 independent experiments). Statistical analyses were performed using unpaired t test with Welch’s correction. (f) Effect of Br-EVs on the permeability of the BBB model to 10 and 70 kDa dextran (mean ± SD; 3 independent experiments). Statistical analysis was performed using two-way ANOVA with Sidak’s multiple comparison tests. (g) Fluorescent microscopy images of TdTom-Br-EVs taken up by endothelial cells (left panel) and astrocytes (right panel) in the BBB-on-a-chip model. (h, upper panels) Representative fluorescent images of the zebrafish brain (area selected by black square), 1 h after EV injection. White arrows demonstrate EVs in brain parenchyma. (h, lower panels) Time-lapse images of the interaction of Br-EV-containing endocytic vesicles (white arrows) with the endothelial abluminal plasma membrane (3 independent experiments). (i) Representative fluorescent images of dextran distribution in zebrafish brain vasculature. (j) Intravascular to extravascular ratio of fluorescence intensity in zebrafish brain following injection of dextran (mean ± SD; 10 kDa dextran, 11 fish per group; 70 kDa dextran, 14 fish per group; 3 independent experiments combined). Statistical analysis was performed using two-way ANOVA with Sidak’s multiple comparison tests. In all panels, ns = not significant; *P ≤ 0.05; **P ≤ 0.01; ***P ≤ 0.001; ****P ≤ 0.0001.