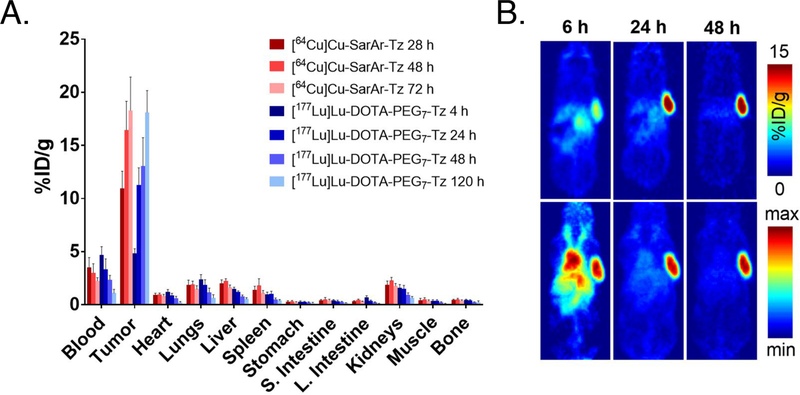
Figure 3.
(A) Biodistribution data for in vivo pretargeting (n = 5) using two different tetrazine radiotracers — [64Cu]Cu-SarAr-Tz and [177Lu]Lu-DOTA-PEG7-Tz — in athymic nude mice bearing subcutaneous SW1222 xenografts. The mice were first administered huA33-TCO (100 μg, 0.67 nmol, 2.4 TCO/mAb) via tail vein, followed 24 hours later by the i.v. administration of [64Cu]Cu-SarAr-Tz (10.4–11.3 MBq, 0.64–0.69 nmol) and 24 h thereafter by the i.v. injection of [177Lu]Lu-DOTA-PEG7-Tz (5.9–6.4 MBq, 0.68–0.73 nmol). The time values represent the number of hours after the administration of each Tz radioligand; (B) PET images of the same mice at 6, 24, and 48 h after the injection of [64Cu]Cu-SarAr-Tz (11.2 MBq, 0.68 nmol). Top row: Coronal planar images that intersect the center of the tumors. Bottom row: maximum intensity projections (MIP).

