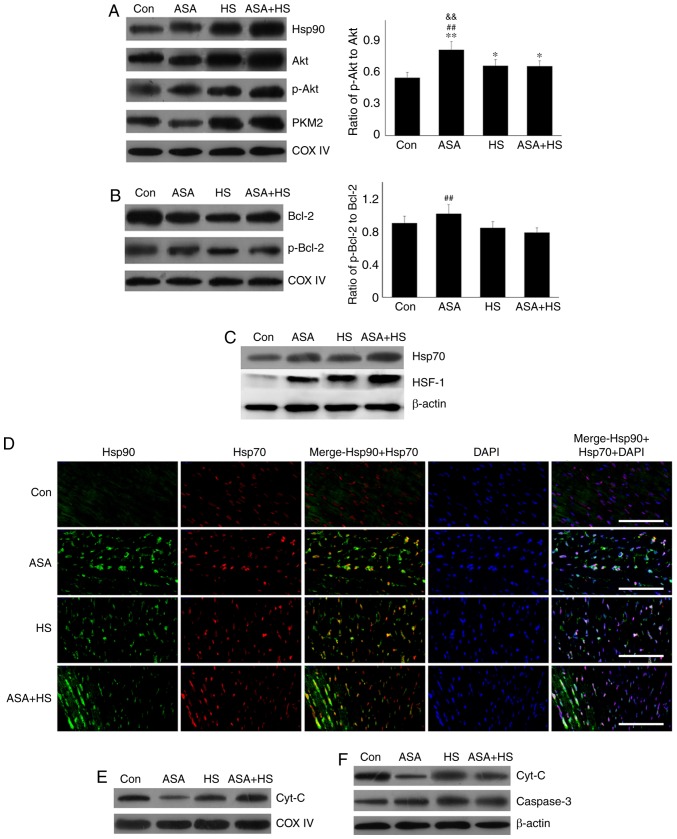
Figure 3.
Effect of higher Hsp90 levels following ASA treatment on the mitochondrial proteins and the influence of intracellular Hsp70 on Hsp90. (A) Representative western blotting results of mitochondrial HSP90, Akt, p-Akt and PKM2 are shown, and the ratios of phosphorylated/total protein abundance are presented. (B) Representative western blotting results of mitochondrial Bcl-2 and p-Bcl-2, and the ratios of phosphorylated/total protein abundance are shown. (C) Representative western blotting results of cellular Hsp70 and HSF-1 are shown. (D) Representative immunohistofluorescence staining images showing the co-localization between Hsp90 and Hsp70 (Hsp90, green fluorescence; Hsp70, red fluorescence; nucleus, blue fluorescence; the merged image of Hsp90 and Hsp70 in the cytoplasm, yellow fluorescence; the merged image of Hsp90 and Hsp70 in the nucleus, white fluorescence) in myocardial tissues. Scale bar=100 µm. (E) Representative western blotting results of mitochondrial cyt c are shown. (F) Representative western blotting results of cytosolic cyt c and caspase-3 are shown. The results are expressed as the mean ± SD; n=5. *P<0.05 and **P<0.01 vs. Con, ##P<0.01 vs. ASA + HS, and the comparison between ASA and HS is indicated by &&P<0.01.

