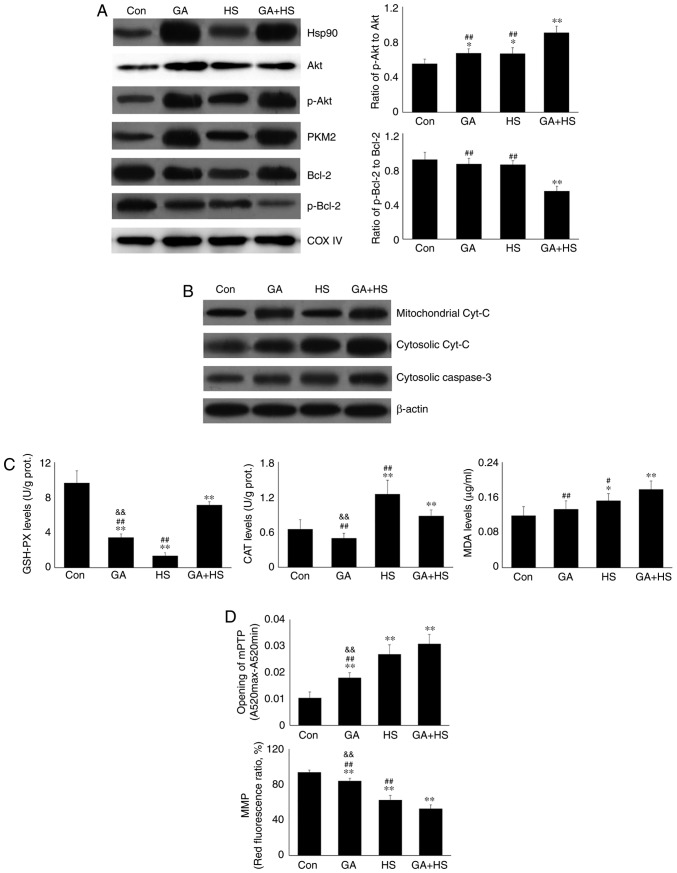
Figure 6.
Effect of Hsp90 functional inhibition on the mitochondrial and cytosolic levels of Hsp90 and associated proteins, and the oxidation levels and function of myocardial mitochondria. (A) Representative western blotting results of mitochondrial Hsp90, Akt, p-Akt, PKM2, Bcl-2 and p-Bcl-2 are shown, and the ratios of phosphorylated/total protein abundance are also presented. (B) Representative western blotting results of mitochondrial cyt c, and cytosolic cyt c and caspase-3 are shown. (C) Effects of Hsp90 functional inhibition on the oxidation levels of myocardial mitochondria. (D) Effects of Hsp90 functional inhibition on the myocardial mitochondria. The relative abundance of all proteins was normalized to that of β-actin. All the results are expressed as the mean ± SD; n=5. *P<0.05 and **P<0.01 vs. Con, #P<0.05 and ##P<0.01 vs. ASA + HS, and the comparison between ASA and HS is indicated by &&P<0.01.

