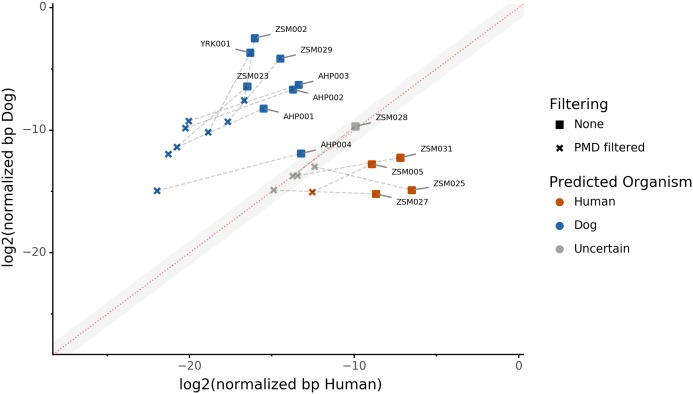
Figure 4. The effect of filtering for damaged reads using PMD.
The log2 of the human NormalizedHostDNA is graphed against the log2 of the dog NormalizedHostDNA. Squares represent samples before filtering by PMD, whereas crosses represent samples after filtering by PMD. Dotted lines show the correspondence between samples. The red diagonal line marks the boundary between the two species, and the grey shaded area indicates a zone of species uncertainty (±1log2FC) due to insufficient genetic information.

