
Extended Data Fig. 1 |. Y2H assay development and validation of HuRI.
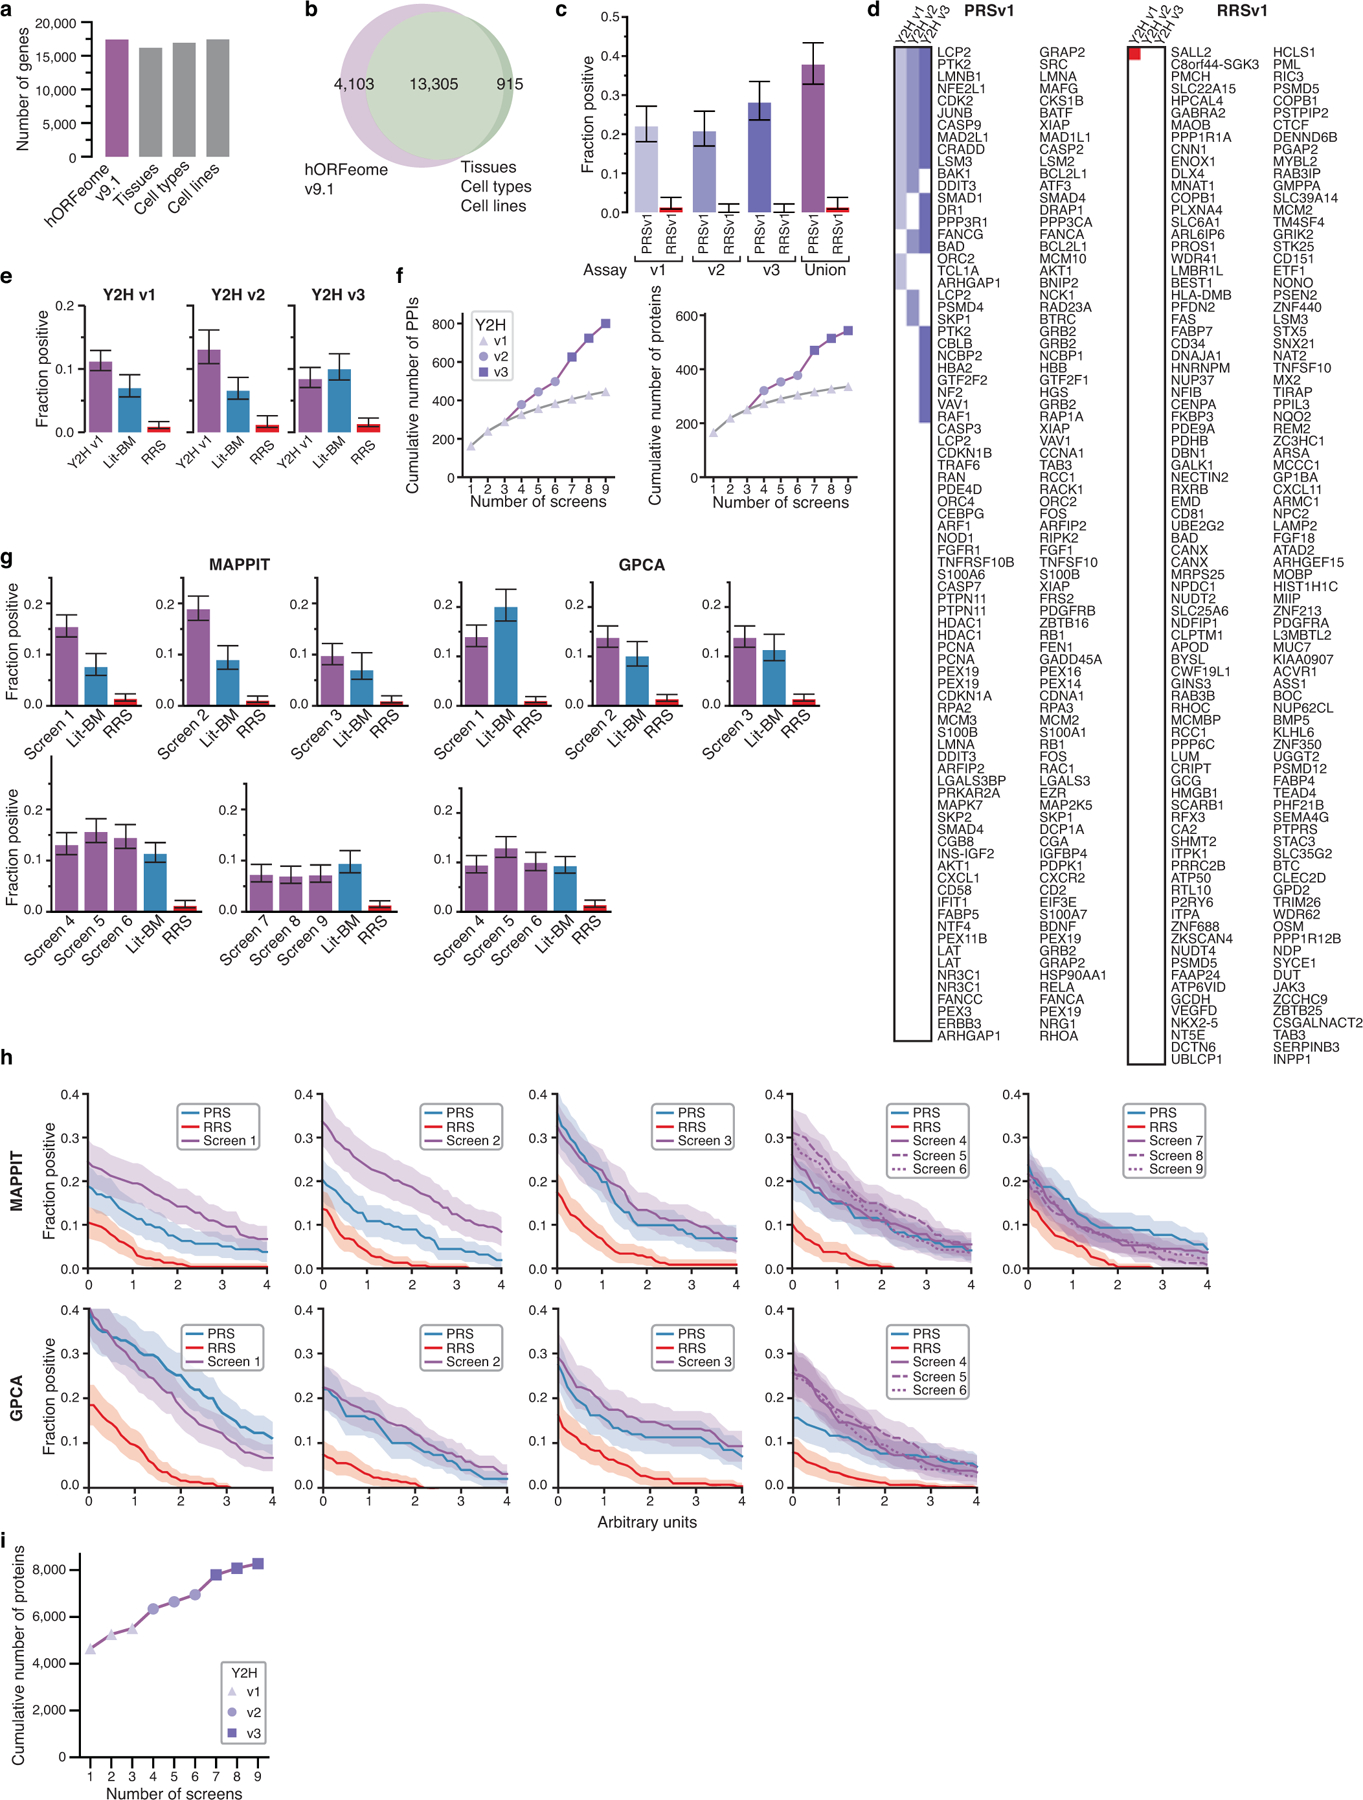
a, Number of protein-coding genes in hORFeome v9.1 and GTEx, FANTOM, and HPA transcriptome projects. The number of genes in hORFeome v9.1 is on par with the number of genes found to be expressed in three comprehensive individual transcriptome sequencing studies and includes 94% of the genes with robust evidence of expression in all three. b, Overlap between hORFeome v9.1 and intersection of transcriptomes in a. c, Individual and combined recovery of PRSv1 and RRSv1 pairs by Y2H assay versions (n = 252, 270). d, Colored squares showing which protein pairs were detected in PRSv1 (left) and RRSv1 (right) by Y2H assay versions. e, Recovery rates of Lit-BM and PPIs from screens of a 2k-by-2k gene test space per Y2H assay version in MAPPIT. f, Cumulative PPI count performing three screens with each Y2H assay version in the test space compared to nine screens with Y2H assay version 1. g, h, MAPPIT and GPCA recovery of Lit-BM and PPIs from screens of Space III when split by screen at a RRS rate of 1% (g) or across a range of thresholds (h). All error bars, in c, e, g, are 68.3% Bayesian confidence interval, shaded error band in h is standard error of proportion and n = between 101 and 395 pairs successfully tested for each category. i, Number of proteins in HuRI, detected with each additional screen.