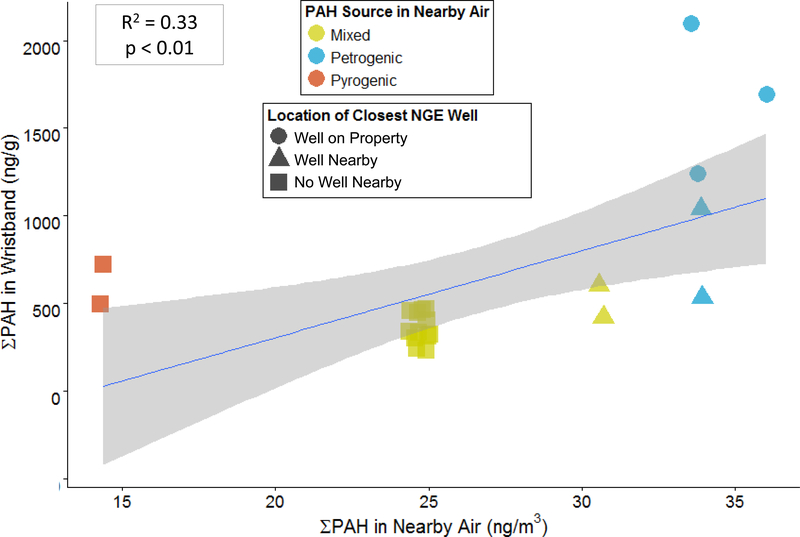
Figure 4.
Principal Components Analysis (PCA) comparing ∑PAH in participants’ wristbands, the distance from participants’ home or workplaces to the nearest NGE well, the petrogenic or pyrogenic signature measured in wristbands (assessed by the fluoranthene/pyrene isomer ratio, small values suggest petrogenic sources), and participants’ self-reported exposures to cigarette smoke and to exhaust from heavy machinery during the studystudy.The shape of the symbol represents each participant’s group,indicating the proximity of their home or workplace to the nearest active NGE well. Pearson’s correlation coefficients for all pairwise correlations between the variables included in this PCA are provided in Table 1.

