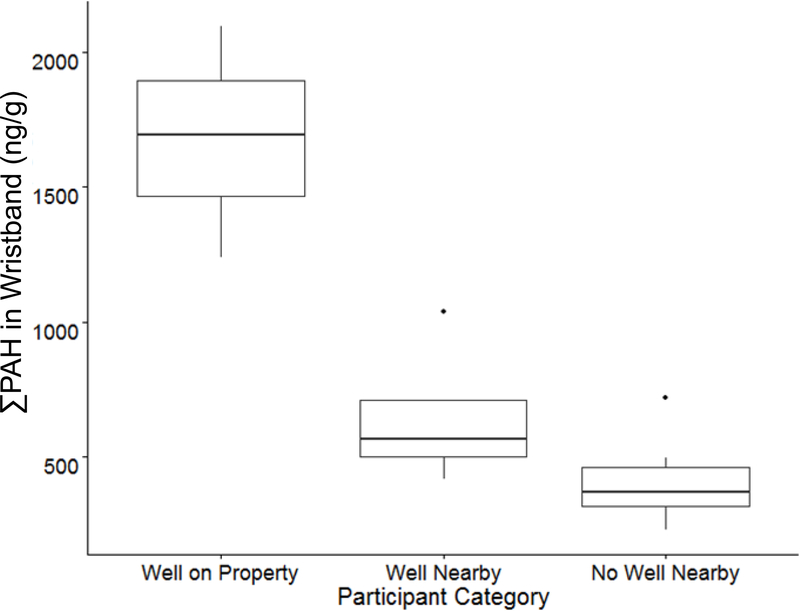
Figure 6.
∑PAH in each participant’s wristband (ng/g wristband) vs. ∑PAH in air measured at the nearest stationary air sampling site to each participant’s home or workplace (ng/m3). There is a significant positive correlation between ∑PAH in a participant’s wristbands and ∑PAH in the inner ring of air samplers at the nearest stationary air sampling site closest to participants’ home or workplaces (simple linear regression, R2 = 0.64, p < 0.0001). Notes: This is currently Figure S2…could consider adding to PCA figure in main text as a/b, or adding as its own figure in main text? (I would argue that it needs some beautification if we’re going to do that)

