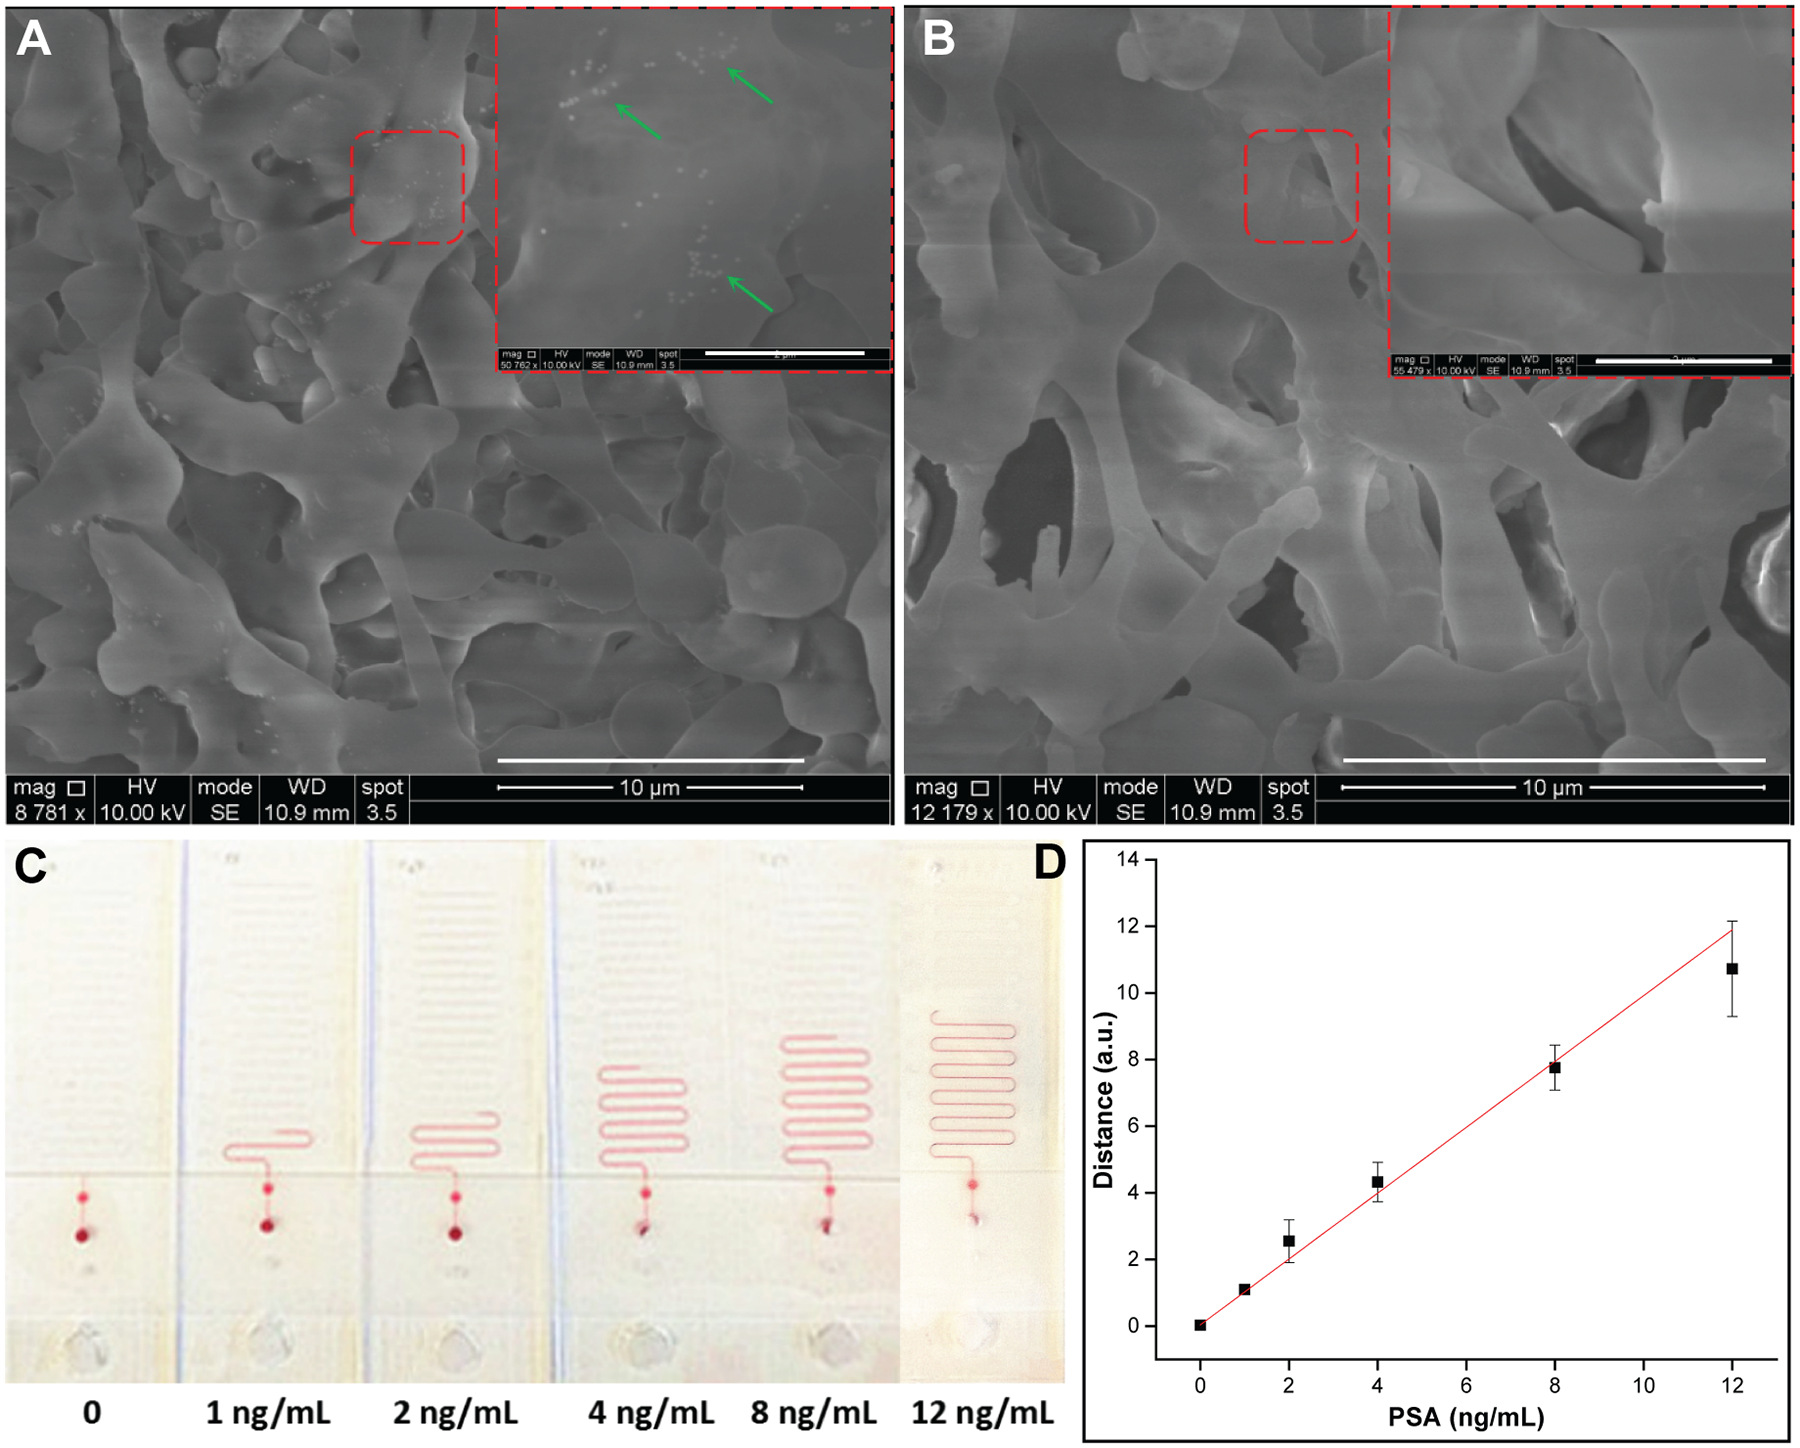
Figure 4.

(A) Scanning electron microscope images of the test zone pads from positive and (B) blank strip, respectively. Scale bar, 10 μm. The insets in the top right corner show the enlarged view of the red dashed squares. Scale bar, 2 μm. The green arrows identify PtNPs in the cavities of nitrocellulose membrane. (C) Quantitation of PSA lateral flow strips with LFA ruler. Ink advancement distances in the LFA ruler with different PSA concentrations (0, 1, 2, 4, 8, and 12 ng/mL, respectively). (D) Linear correlation between ink advancement distance and PSA concentration, tested in triplicates (r2 = 0.99).
