
Figure 5.
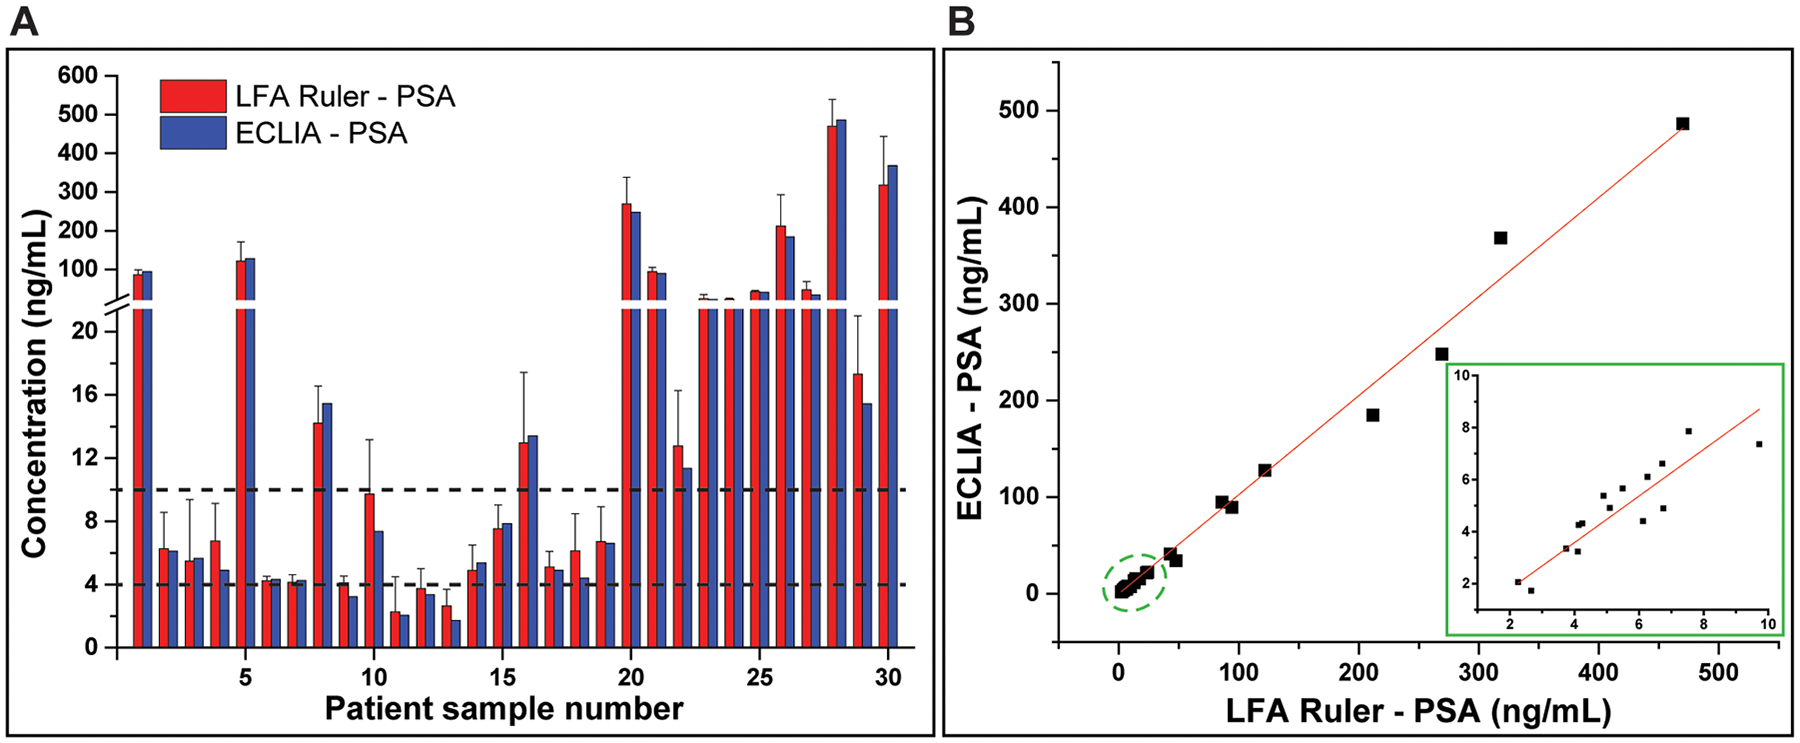
Validation of the LFA ruler against clinical gold standard PSA assay. (A) Histogram of the clinical serum sample test results generated by the LFA ruler (mean ± standard error) and the ECLIA assay (Roche Elecsys Cobas Total PSA). Two dashed lines represent the clinical cutoffs for PSA, 4 ng/mL and 10 ng/mL, respectively. (B) Linear relationship between the LFA ruler and standard clinical results with an r2 value of 0.92. (r2 = 0.95 in the inset, for PSA concentrations below 12 ng/mL).