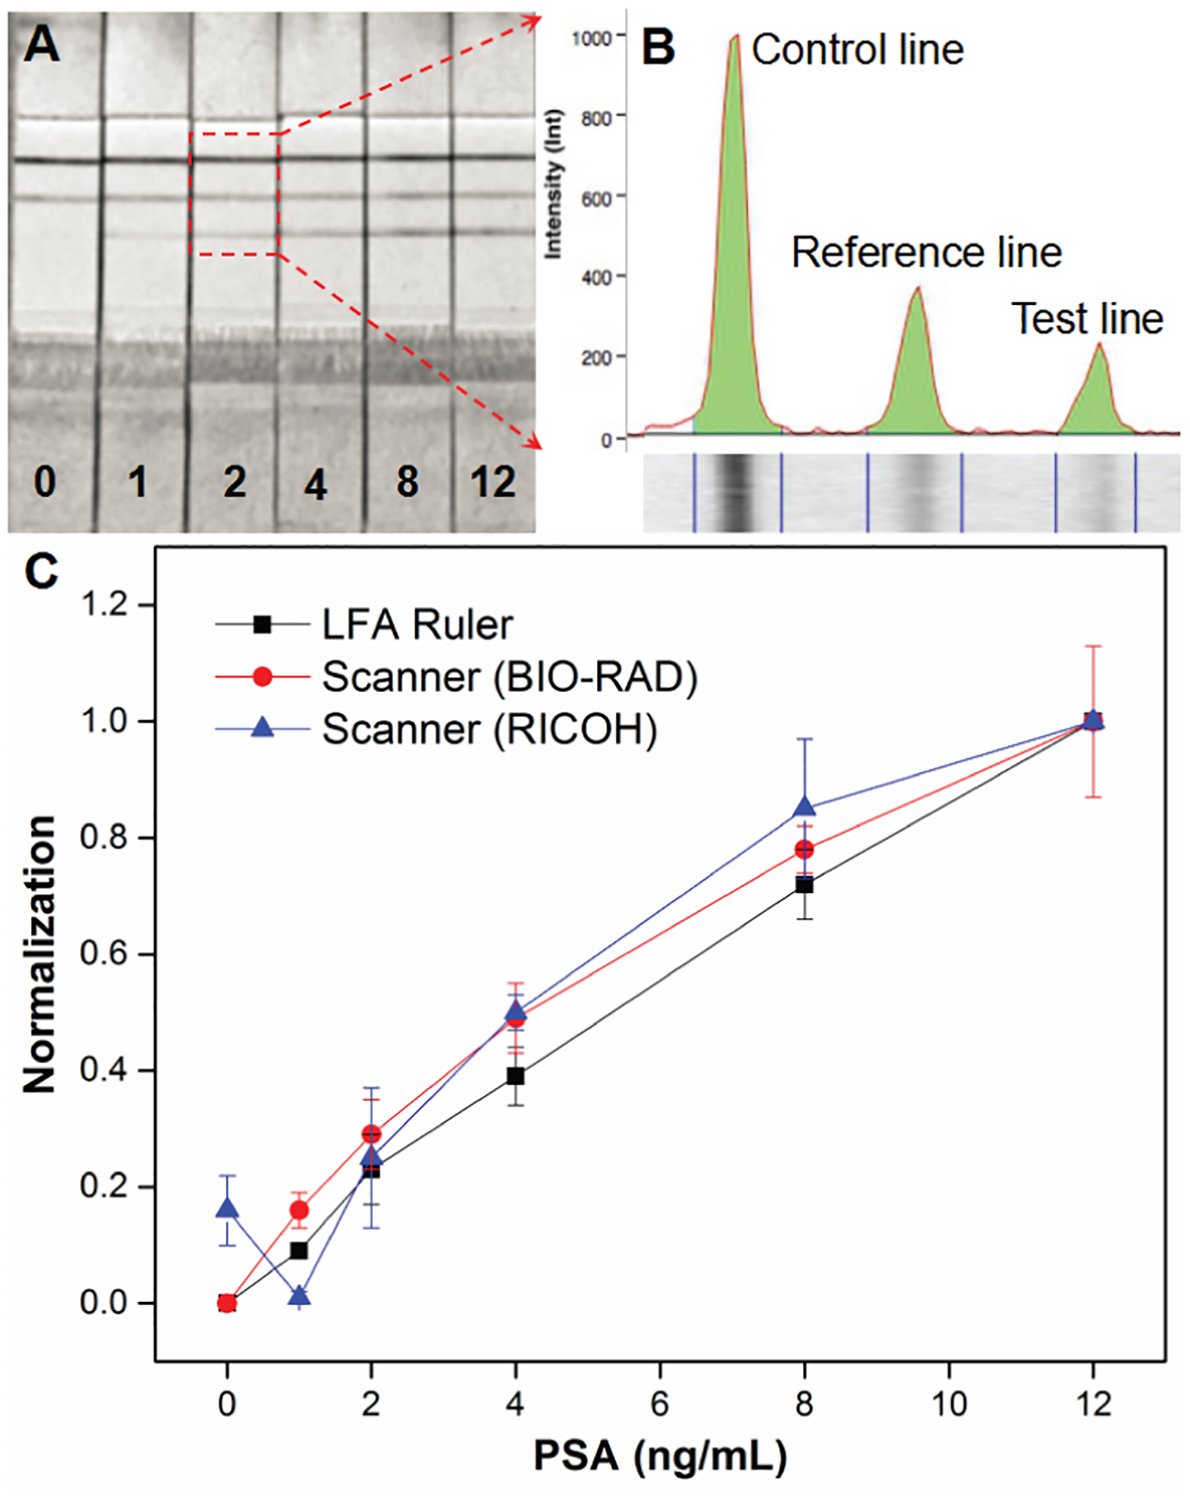
Figure 6.

Comparison of quantitative ability of LFA ruler and commercial PSA strips with scanner. (A) The scanning images of commercial strips (Instant-view® PSA Whole Blood/Serum Test) with different PSA concentrations (0, 1, 2, 4, 8, and 12 ng/mL, respectively) using laboratory Gel Doc™ XR+ System (Bio-Rad). (B) The intensity of control line, reference line and test line were analyzed using the Image Lab™ software. (C) The normalization plots of LFA ruler (black square), commercial PSA strips with Bio-Rad scanner (red circle) and Ricoh MP C3004 office scanner (blue triangle).
